Consider the polynomial regression model of degree r, Y₁ = Po + B₁X₁ + B₂X² + ***+BX+μ₁- According to the null hypothesis that the regression is linear and the alternative that is a polynomial of degree r corresponds to: 0 vs. H₁: at least one ; #0, j= 2,...,. A. Ho: B₂=0, P3=0,..., B. H₁ : P₂ = 0, $3 = 0₁., 0 vs. H₁: all p;#0, j=2,...,r. OC. Ho : B₁ = 0 vs. H₁ : B₁ *0. D. Ho: p=0 vs. H₁ :p, *0.
Consider the polynomial regression model of degree r, Y₁ = Po + B₁X₁ + B₂X² + ***+BX+μ₁- According to the null hypothesis that the regression is linear and the alternative that is a polynomial of degree r corresponds to: 0 vs. H₁: at least one ; #0, j= 2,...,. A. Ho: B₂=0, P3=0,..., B. H₁ : P₂ = 0, $3 = 0₁., 0 vs. H₁: all p;#0, j=2,...,r. OC. Ho : B₁ = 0 vs. H₁ : B₁ *0. D. Ho: p=0 vs. H₁ :p, *0.

Elementary Linear Algebra (MindTap Course List)
8th Edition
ISBN:9781305658004
Author:Ron Larson
Publisher:Ron Larson
Chapter5: Inner Product Spaces
Section5.4: Mathematical Models And Least Squares Analysis
Problem 40E

Related questions
Question
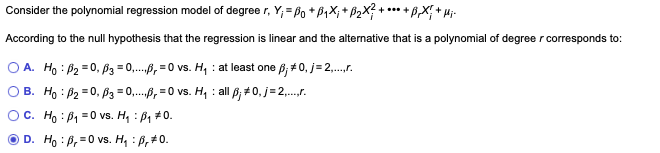
Transcribed Image Text:Consider the polynomial regression model of degreer, Y₁ =Po + B₁X₁ + ₂X² +*+BX! + Hi-
According to the null hypothesis that the regression is linear and the alternative that is a polynomial of degree r corresponds to:
OA. Ho: P₂=0, P3 = 0,...,0 vs. H₁: at least one p; * 0, j = 2,...,.r.
B. Ho: P₂=0, P3=0,..., = 0 vs. H₁: all p;#0, j= 2,...,r.
OC. Ho : B₁ = 0 vs. H₁ : B₁ #0.
D. Ho: P₁=0 vs. H₁ : P, ‡0.
Expert Solution
This question has been solved!
Explore an expertly crafted, step-by-step solution for a thorough understanding of key concepts.

This is a popular solution!

Trending now
This is a popular solution!

Step by step
Solved in 2 steps

Recommended textbooks for you
Elementary Linear Algebra (MindTap Course List)
Algebra
ISBN:
9781305658004
Author:
Ron Larson
Publisher:
Cengage Learning

Algebra & Trigonometry with Analytic Geometry
Algebra
ISBN:
9781133382119
Author:
Swokowski
Publisher:
Cengage
Elementary Linear Algebra (MindTap Course List)
Algebra
ISBN:
9781305658004
Author:
Ron Larson
Publisher:
Cengage Learning
Algebra & Trigonometry with Analytic Geometry
Algebra
ISBN:
9781133382119
Author:
Swokowski
Publisher:
Cengage