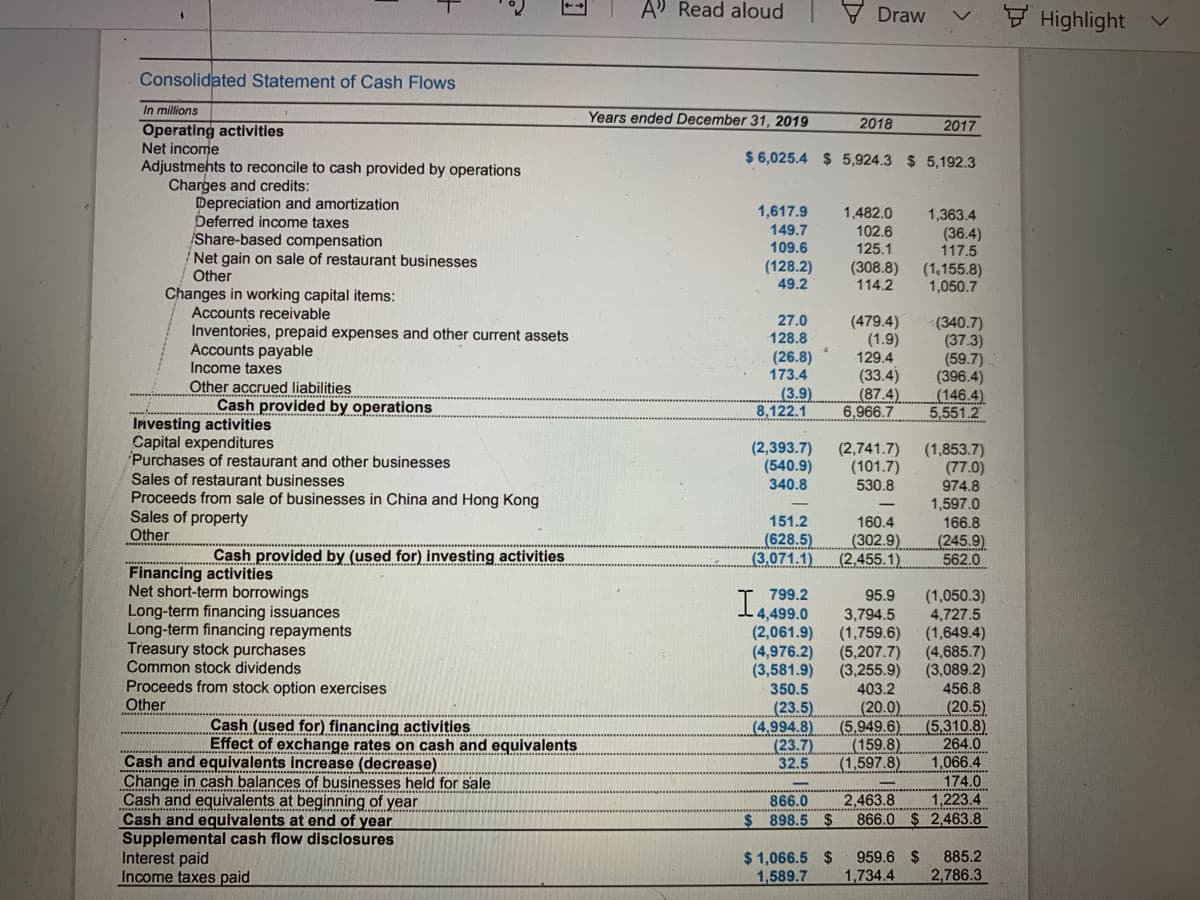
Consolidated Statement of Cash Flows In millions Years ended December 31, 2019 2018 2017 Operating activities Net income Adjustmehts to reconcile to cash provided by operations $ 6,025.4 $ 5,924.3 $ 5,192.3 Charges and credits: Depreciation and amortization Deferred income taxes Share-based compensation Net gain on sale of restaurant businesses Other Changes in working capital items: Accounts receivable Inventories, prepaid expenses and other current assets Accounts payable Income taxes Other accrued liabilities Cash provided by operations 1,617.9 149.7 109.6 1,482.0 102.6 125.1 1,363.4 (36.4) 117.5 (1,155.8) 1,050.7 (128.2) 49.2 (308.8) 114.2 27.0 (479.4) (340.7) (37.3) (59.7) (396.4) (146.4) 5,551.2 128.8 (1.9) 129.4 (26.8) 173.4 (3.9) 8,122.1 (33.4) (87.4) 6,966.7 Investing activities Capital expenditures Purchases of restaurant and other businesses Sales of restaurant businesses Proceeds from sale of businesses in China and Hong Kong Sales of property Other (2,393.7) (540.9) 340.8 (2,741.7) (101.7) 530.8 (1,853.7) (77.0) 974.8 1,597.0 151.2 (628.5) (3,071.1) 160.4 166.8 Cash provided by (used for) investing activities (302.9) (2,455.1) (245.9) 562.0 Financing activities Net short-term borrowings Long-term financing issuances Long-term financing repayments Treasury stock purchases Common stock dividends Proceeds from stock option exercises Other L 799.2 95.9 -4,499.0 (2,061.9) (4,976.2) (3,581.9) 350.5 3,794.5 (1,759.6) (5,207.7) (3,255.9) 403.2 (1,050.3) 4,727.5 (1,649.4) (4,685.7) (3,089.2) 456.8 Cash (used for) financing activities Effect of exchange rates on cash and equivalents (23.5) (4,994.8) (23.7) 32.5 (20.0) (5,949.6) (159.8) (1,597.8) (20.5) (5,310.8) 264.0 Cash and equivalents increase (decrease) Change in cash balances of businesses held for sale Cash and equivalents at beginning of year Cash and equivalents at end of year Supplemental cash flow disclosures Interest paid Income taxes paid 1,066.4 .*.. 866.0 $ 898.5 $ 174.0 1,223.4 866.0 $ 2,463.8 2,463.8 ......... $ 1,066.5 $ 1,589.7 959.6 $ 1,734.4 885.2 2,786.3
Consolidated Statement of Cash Flows In millions Years ended December 31, 2019 2018 2017 Operating activities Net income Adjustmehts to reconcile to cash provided by operations $ 6,025.4 $ 5,924.3 $ 5,192.3 Charges and credits: Depreciation and amortization Deferred income taxes Share-based compensation Net gain on sale of restaurant businesses Other Changes in working capital items: Accounts receivable Inventories, prepaid expenses and other current assets Accounts payable Income taxes Other accrued liabilities Cash provided by operations 1,617.9 149.7 109.6 1,482.0 102.6 125.1 1,363.4 (36.4) 117.5 (1,155.8) 1,050.7 (128.2) 49.2 (308.8) 114.2 27.0 (479.4) (340.7) (37.3) (59.7) (396.4) (146.4) 5,551.2 128.8 (1.9) 129.4 (26.8) 173.4 (3.9) 8,122.1 (33.4) (87.4) 6,966.7 Investing activities Capital expenditures Purchases of restaurant and other businesses Sales of restaurant businesses Proceeds from sale of businesses in China and Hong Kong Sales of property Other (2,393.7) (540.9) 340.8 (2,741.7) (101.7) 530.8 (1,853.7) (77.0) 974.8 1,597.0 151.2 (628.5) (3,071.1) 160.4 166.8 Cash provided by (used for) investing activities (302.9) (2,455.1) (245.9) 562.0 Financing activities Net short-term borrowings Long-term financing issuances Long-term financing repayments Treasury stock purchases Common stock dividends Proceeds from stock option exercises Other L 799.2 95.9 -4,499.0 (2,061.9) (4,976.2) (3,581.9) 350.5 3,794.5 (1,759.6) (5,207.7) (3,255.9) 403.2 (1,050.3) 4,727.5 (1,649.4) (4,685.7) (3,089.2) 456.8 Cash (used for) financing activities Effect of exchange rates on cash and equivalents (23.5) (4,994.8) (23.7) 32.5 (20.0) (5,949.6) (159.8) (1,597.8) (20.5) (5,310.8) 264.0 Cash and equivalents increase (decrease) Change in cash balances of businesses held for sale Cash and equivalents at beginning of year Cash and equivalents at end of year Supplemental cash flow disclosures Interest paid Income taxes paid 1,066.4 .*.. 866.0 $ 898.5 $ 174.0 1,223.4 866.0 $ 2,463.8 2,463.8 ......... $ 1,066.5 $ 1,589.7 959.6 $ 1,734.4 885.2 2,786.3

Cornerstones of Financial Accounting
4th Edition
ISBN:9781337690881
Author:Jay Rich, Jeff Jones
Publisher:Jay Rich, Jeff Jones
Chapter8: Current And Contingent Liabilities
Section: Chapter Questions
Problem 72E: Ratio Analysis Intel Corporation provided the following information on its balance sheet and...

Related questions
Question
Transcribed Image Text:A Read aloud
V Draw
7 Highlight
Consolidated Statement of Cash Flows
In millions
Years ended December 31, 2019
2018
2017
Operating activities
Net income
Adjustmehts to reconcile to cash provided by operations
$ 6,025.4 $ 5,924.3 $ 5,192.3
Charges and credits:
Depreciation and amortization
Deferred income taxes
Share-based compensation
Net gain on sale of restaurant businesses
Other
1,617.9
1,482.0
1,363.4
149.7
102.6
125.1
(36.4)
117.5
109.6
(128.2)
49.2
(308.8)
114.2
(1,155.8)
1,050.7
Changes in working capital items:
Accounts receivable
27.0
128.8
Inventories, prepaid expenses and other current assets
Accounts payable
Income taxes
Other accrued liabilities
Cash provided by operations
(479.4)
(1.9)
129.4
(33.4)
(87.4)
6,966.7
(340.7)
(37.3)
(59.7)
(396.4)
(146.4)
5,551.2
(26.8)
173.4
(3.9)
8,122.1
Investing activities
Capital expenditures
Purchases of restaurant and other businesses
Sales of restaurant businesses
Proceeds from sale of businesses in China and Hong Kong
Sales of property
Other
(2,393.7)
(540.9)
340.8
(2,741.7)
(101.7)
530.8
(1,853.7)
(77.0)
974.8
1,597.0
151.2
160.4
(628.5)
(3.071.1)
(302.9)
(2,455.1)
166.8
(245.9)
562.0
Cash provided by (used for) investing activities
Financing activities
Net short-term borrowings
Long-term financing issuances
Long-term financing repayments
Treasury stock purchases
Common stock dividends
799.2
L4,499.0
95.9
(2,061.9)
(4,976.2)
(3,581.9)
350.5
3,794.5
(1,759.6)
(5,207.7)
(3,255.9)
403.2
(1,050.3)
4,727.5
(1,649.4)
(4,685.7)
(3,089.2)
456.8
Proceeds from stock option exercises
Other
(23.5)
(4,994.8)
(23.7)
32.5
(20.0)
(5,949.6)
(159.8)
(1,597.8)
(20.5)
(5,310.8)
264.0
1,066.4
174.0
1,223.4
866.0 $ 2,463.8
Cash (used for) financing activities
Effect of exchange rates on cash and equivalents
Cash and equivalents increase (decrease)
Change in cash balances of businesses held for sale
Cash and equivalents at beginning of year
Cash and equivalents at end of year
Supplemental cash flow disclosures
Interest paid
Income taxes paid
866.0
2,463.8
$898.5 $
$ 1,066.5 $
1,589.7
959.6 $
1,734.4
885.2
2,786.3
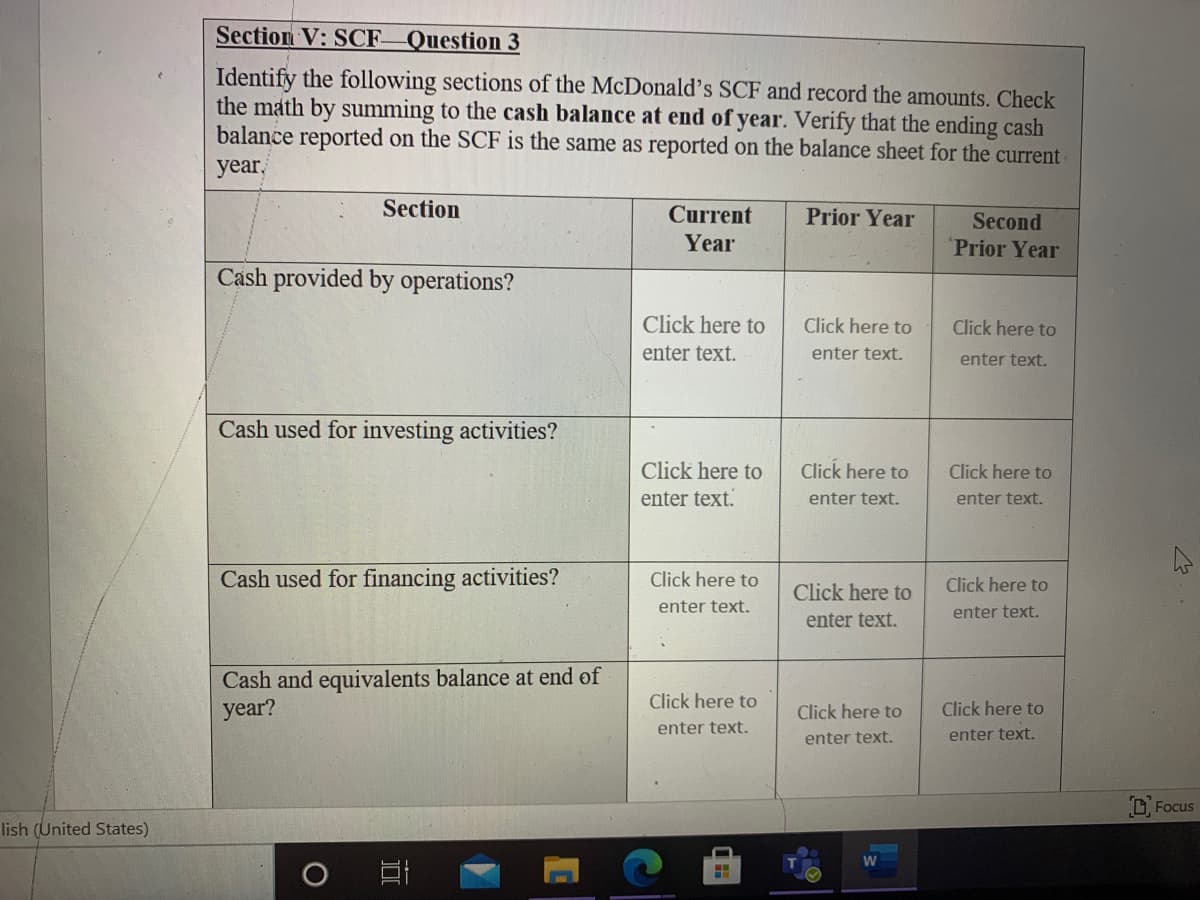
Transcribed Image Text:Section V: SCF Question 3
Identify the following sections of the McDonald's SCF and record the amounts. Check
the math by summing to the cash balance at end of year. Verify that the ending cash
balance reported on the SCF is the same as reported on the balance sheet for the current
year,
Section
Current
Prior Year
Second
Prior Year
Year
Cash provided by operations?
Click here to
Click here to
Click here to
enter text.
enter text.
enter text.
Cash used for investing activities?
Click here to
Click here to
Click here to
enter text.
enter text.
enter text.
Cash used for financing activities?
Click here to
Click here to
Click here to
enter text.
enter text.
enter text.
Cash and equivalents balance at end of
year?
Click here to
Click here to
Click here to
enter text.
enter text.
enter text.
D Focus
lish (United States)
Expert Solution
This question has been solved!
Explore an expertly crafted, step-by-step solution for a thorough understanding of key concepts.

Step by step
Solved in 2 steps with 1 images

Knowledge Booster


Learn more about
Need a deep-dive on the concept behind this application? Look no further. Learn more about this topic, accounting and related others by exploring similar questions and additional content below.Recommended textbooks for you
Cornerstones of Financial Accounting
Accounting
ISBN:
9781337690881
Author:
Jay Rich, Jeff Jones
Publisher:
Cengage Learning

Financial Accounting: The Impact on Decision Make…
Accounting
ISBN:
9781305654174
Author:
Gary A. Porter, Curtis L. Norton
Publisher:
Cengage Learning

Intermediate Accounting: Reporting And Analysis
Accounting
ISBN:
9781337788281
Author:
James M. Wahlen, Jefferson P. Jones, Donald Pagach
Publisher:
Cengage Learning
Cornerstones of Financial Accounting
Accounting
ISBN:
9781337690881
Author:
Jay Rich, Jeff Jones
Publisher:
Cengage Learning
Financial Accounting: The Impact on Decision Make…
Accounting
ISBN:
9781305654174
Author:
Gary A. Porter, Curtis L. Norton
Publisher:
Cengage Learning
Intermediate Accounting: Reporting And Analysis
Accounting
ISBN:
9781337788281
Author:
James M. Wahlen, Jefferson P. Jones, Donald Pagach
Publisher:
Cengage Learning


Corporate Financial Accounting
Accounting
ISBN:
9781337398169
Author:
Carl Warren, Jeff Jones
Publisher:
Cengage Learning

Managerial Accounting
Accounting
ISBN:
9781337912020
Author:
Carl Warren, Ph.d. Cma William B. Tayler
Publisher:
South-Western College Pub