CONSOLIDATED STATEMENTS OF FINANCIAL POSITION ASSETS Current Assets Cash and cash equivalents Trade and other receivables - net Due from related parties Inventories - net Biological assets Notes 9 27 10 14 2020 Decem P 1,229,381,273 7,599,984,172 280,788,885 14,313,100,885 65,726,630
CONSOLIDATED STATEMENTS OF FINANCIAL POSITION ASSETS Current Assets Cash and cash equivalents Trade and other receivables - net Due from related parties Inventories - net Biological assets Notes 9 27 10 14 2020 Decem P 1,229,381,273 7,599,984,172 280,788,885 14,313,100,885 65,726,630

Chapter14: Security Structures And Determining Enterprise Values
Section: Chapter Questions
Problem 8EP

Related questions
Question
Find the net fair value of an asset
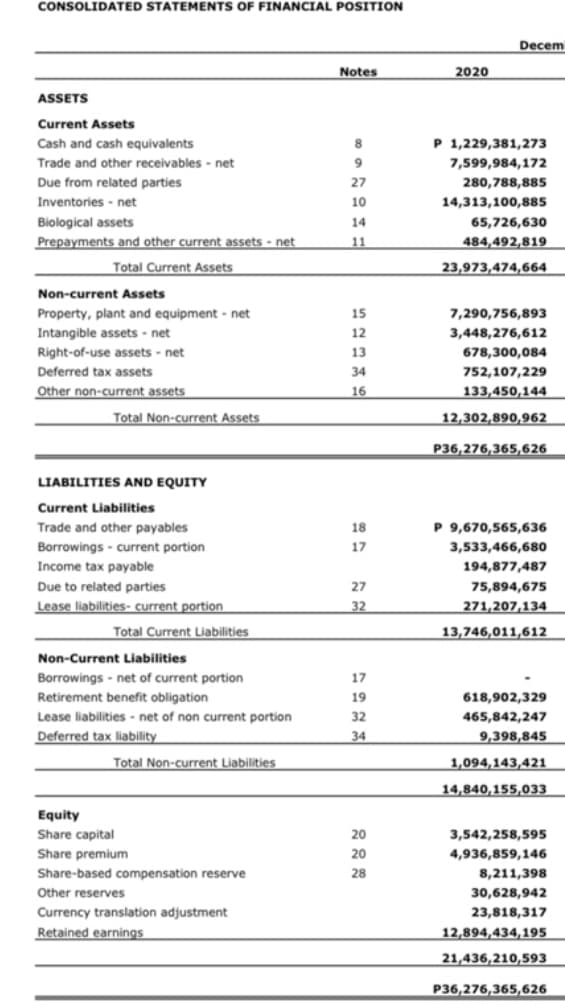
Transcribed Image Text:CONSOLIDATED STATEMENTS OF FINANCIAL POSITION
Decem
Notes
2020
ASSETS
Current Assets
P 1,229,381,273
7,599,984,172
Cash and cash equivalents
Trade and other receivables - net
9
Due from related parties
27
280,788,885
Inventories - net
10
14,313,100,885
Biological assets
14
65,726,630
Prepayments and other current assets - net
11
484,492,819
Total Current Assets
23,973,474,664
Non-current Assets
Property, plant and equipment - net
15
7,290,756,893
Intangible assets - net
12
3,448,276,612
Right-of-use assets - net
13
678,300,084
Deferred tax assets
34
752,107,229
Other non-current assets
16
133,450,144
Total Non-current Assets
12,302,890,962
P36,276,365,626
LIABILITIES AND EQUITY
Current Liabilities
Trade and other payables
18
P 9,670,565,636
Borrowings - current portion
17
3,533,466,680
Income tax payable
194,877,487
Due to related parties
27
75,894,675
Lease liabilities- current portion
32
271,207,134
Total Current Liabilities
13,746,011,612
Non-Current Liabilities
Borrowings - net of current portion
Retirement benefit obligation
17
19
618,902,329
Lease liabilities - net of non current portion
32
465,842,247
Deferred tax liability
34
9,398,845
Total Non-current Liabilities
1,094,143,421
14,840,155,033
Equity
Share capital
Share premium
20
3,542,258,595
20
4,936,859,146
Share-based compensation reserve
28
8,211,398
Other reserves
30,628,942
Currency translation adjustment
23,818,317
Retained earnings
12,894,434,195
21,436,210,593
P36,276,365,626
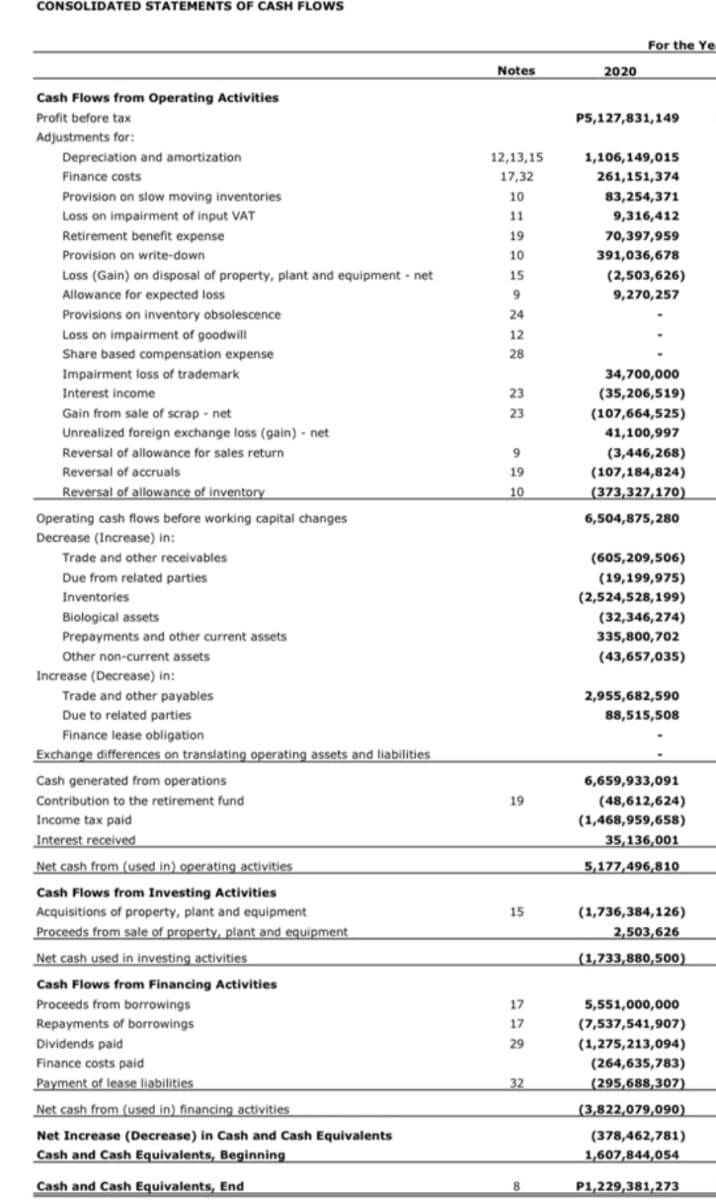
Transcribed Image Text:CONSOLIDATED STATEMENTS OF CASH FLOWS
For the Ye
Notes
2020
Cash Flows from Operating Activities
Profit before tax
P5,127,831,149
Adjustments for:
Depreciation and amortization
12,13,15
1,106,149,015
Finance costs
17,32
261,151,374
Provision on slow moving inventories
10
83,254,371
Loss on impairment of input VAT
11
9,316,412
Retirement benefit expense
19
70,397,959
Provision on write-down
10
391,036,678
Loss (Gain) on disposal of property, plant and equipment - net
15
(2,503,626)
Allowance for expected loss
9
9,270,257
Provisions on inventory obsolescence
24
Loss on impairment of goodwill
Share based compensation expense
12
28
Impairment loss of trademark
34,700,000
Interest income
23
(35,206,519)
Gain from sale of scrap - net
Unrealized foreign exchange loss (gain) - net
23
(107,664,525)
41,100,997
Reversal of allowance for sales return
9
(3,446,268)
Reversal of accruals
19
(107,184,824)
Reversal of allowance of inventory
10
_(373,327,170)
Operating cash flows before working capital changes
6,504,875,280
Decrease (Increase) in:
Trade and other receivables
(605,209,506)
Due from related parties
Inventories
(19,199,975)
(2,524,528,199)
Biological assets
(32,346,274)
Prepayments and other current assets
335,800,702
Other non-current assets
(43,657,035)
Increase (Decrease) in:
2,955,682,590
Trade and other payables
Due to related parties
88,515,508
Finance lease obligation
Exchange differences on translating operating assets and liabilities
Cash generated from operations
6,659,933,091
Contribution to the retirement fund
19
(48,612,624)
Income tax paid
(1,468,959,658)
Interest received
35,136,001
Net cash from (used in) operating activities
5,177,496,810
Cash Flows from Investing Activities
Acquisitions of property, plant and equipment
Proceeds from sale of property, plant and equipment
15
(1,736,384,126)
2,503,626
Net cash used in investing activities
(1,733,880,500)
Cash Flows from Financing Activities
Proceeds from borrowings
17
5,551,000,000
Repayments of borrowings
17
(7,537,541,907)
(1,275,213,094)
Dividends paid
Finance costs paid
29
(264,635,783)
Payment of lease liabilities
32
(295,688,307)
Net cash from (used in) financing activities
(3,822,079,090)
Net Increase (Decrease) in Cash and Cash Equivalents
(378,462,781)
Cash and Cash Equivalents, Beginning
1,607,844,054
Cash and Cash Equivalents, End
P1,229,381,273
Expert Solution
This question has been solved!
Explore an expertly crafted, step-by-step solution for a thorough understanding of key concepts.

Step by step
Solved in 3 steps

Knowledge Booster


Learn more about
Need a deep-dive on the concept behind this application? Look no further. Learn more about this topic, accounting and related others by exploring similar questions and additional content below.Recommended textbooks for you

Financial Reporting, Financial Statement Analysis…
Finance
ISBN:
9781285190907
Author:
James M. Wahlen, Stephen P. Baginski, Mark Bradshaw
Publisher:
Cengage Learning

Financial Accounting: The Impact on Decision Make…
Accounting
ISBN:
9781305654174
Author:
Gary A. Porter, Curtis L. Norton
Publisher:
Cengage Learning
Financial Reporting, Financial Statement Analysis…
Finance
ISBN:
9781285190907
Author:
James M. Wahlen, Stephen P. Baginski, Mark Bradshaw
Publisher:
Cengage Learning
Financial Accounting: The Impact on Decision Make…
Accounting
ISBN:
9781305654174
Author:
Gary A. Porter, Curtis L. Norton
Publisher:
Cengage Learning