Construct a histogram displaying your data. In complete sentences, describe the shape of your graph. Construct a box plot displaying your data. Does the middle 50% of the data appear to be concentrated together or spread apart? Explain how you determined this. Looking at both the histogram and the box plot, discuss the distribution of your data
Construct a histogram displaying your data. In complete sentences, describe the shape of your graph. Construct a box plot displaying your data. Does the middle 50% of the data appear to be concentrated together or spread apart? Explain how you determined this. Looking at both the histogram and the box plot, discuss the distribution of your data

Functions and Change: A Modeling Approach to College Algebra (MindTap Course List)
6th Edition
ISBN:9781337111348
Author:Bruce Crauder, Benny Evans, Alan Noell
Publisher:Bruce Crauder, Benny Evans, Alan Noell
ChapterP: Prologue: Calculator Arithmetic
Section: Chapter Questions
Problem 1CR

Related questions
Question
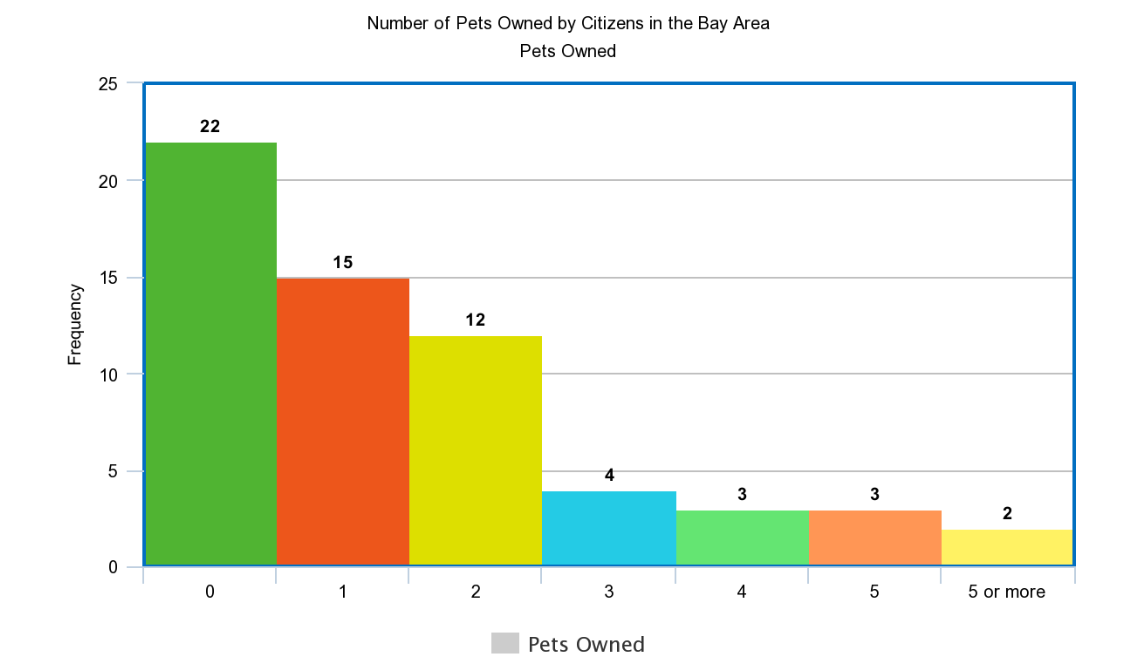
Construct a histogram displaying your data.
In complete sentences, describe the shape of your graph.
Construct a box plot displaying your data.
Does the middle 50% of the data appear to be concentrated together or spread apart? Explain how you determined this.
Looking at both the histogram and the box plot, discuss the distribution of your data.
alue smaller than 3 and larger than 5 will be considered an outlier.
Transcribed Image Text:Frequency
25
20
15
10
5
0
22
0
Number of Pets Owned by Citizens in the Bay Area
Pets Owned
15
3
1
12
2
3
Pets Owned
3
2
5 or more
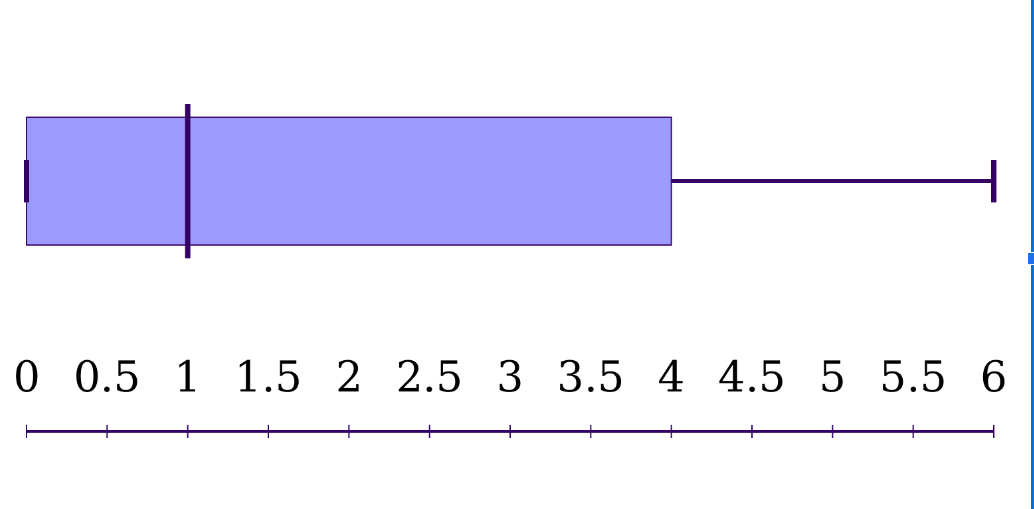
Transcribed Image Text:0 0.5 1 1.5 2 2.5 3 3.5 4 4.5 5 5.5 6
Expert Solution
This question has been solved!
Explore an expertly crafted, step-by-step solution for a thorough understanding of key concepts.

This is a popular solution!

Trending now
This is a popular solution!

Step by step
Solved in 2 steps

Recommended textbooks for you
Functions and Change: A Modeling Approach to Coll…
Algebra
ISBN:
9781337111348
Author:
Bruce Crauder, Benny Evans, Alan Noell
Publisher:
Cengage Learning
Functions and Change: A Modeling Approach to Coll…
Algebra
ISBN:
9781337111348
Author:
Bruce Crauder, Benny Evans, Alan Noell
Publisher:
Cengage Learning