Construct one table that includes relative frequencies based on the frequency distributions shown below, then compare the amoun honfiltered and filtered cigarettes. Do the cigarette filters appear to be effective? (Hint: The filters reduce the amount of tar ingested smoker.) Click the icon to view the frequency distributions. Complete the relative frequency table below. Relative Relative Frequency Tar (mg) (Nonfiltered) % % |% % Frequency (Filtered) % % |% % % 4-7 8-11 12 - 15 16 - 19 20 - 23 24 - 27 % % 28 -31 % Simplify your answers.)
Construct one table that includes relative frequencies based on the frequency distributions shown below, then compare the amoun honfiltered and filtered cigarettes. Do the cigarette filters appear to be effective? (Hint: The filters reduce the amount of tar ingested smoker.) Click the icon to view the frequency distributions. Complete the relative frequency table below. Relative Relative Frequency Tar (mg) (Nonfiltered) % % |% % Frequency (Filtered) % % |% % % 4-7 8-11 12 - 15 16 - 19 20 - 23 24 - 27 % % 28 -31 % Simplify your answers.)

Glencoe Algebra 1, Student Edition, 9780079039897, 0079039898, 2018
18th Edition
ISBN:9780079039897
Author:Carter
Publisher:Carter
Chapter10: Statistics
Section10.6: Summarizing Categorical Data
Problem 42PFA

Related questions

Concept explainers
Contingency Table
A contingency table can be defined as the visual representation of the relationship between two or more categorical variables that can be evaluated and registered. It is a categorical version of the scatterplot, which is used to investigate the linear relationship between two variables. A contingency table is indeed a type of frequency distribution table that displays two variables at the same time.
Binomial Distribution
Binomial is an algebraic expression of the sum or the difference of two terms. Before knowing about binomial distribution, we must know about the binomial theorem.
Topic Video
Question
Do cigarette filters appear to be effective?
No, because the relative frequency of the higher tar classes is greater for filtered cigarettes.
No, because the relative frequencies for each are not substantially different.
Yes, because the relative frequency of the higher tar classes is greater for nonfiltered cigarettes.
This cannot be determined.
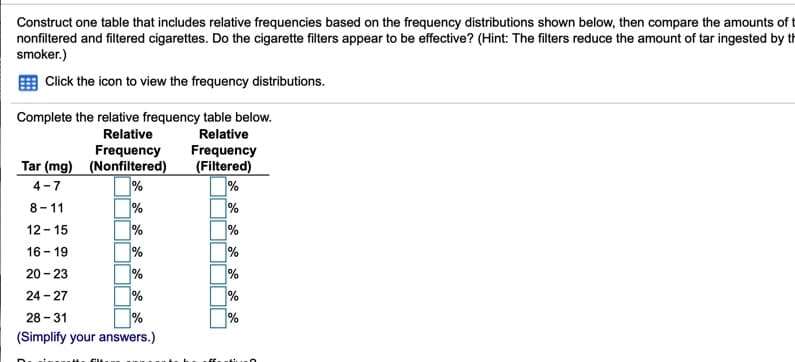
Transcribed Image Text:Construct one table that includes relative frequencies based on the frequency distributions shown below, then compare the amounts of t
nonfiltered and filtered cigarettes. Do the cigarette filters appear to be effective? (Hint: The filters reduce the amount of tar ingested by th
smoker.)
Click the icon to view the frequency distributions.
Complete the relative frequency table below.
Relative
Relative
Frequency
Tar (mg) (Nonfiltered)
Frequency
(Filtered)
%
%
4-7
8-11
%
12 - 15
16 - 19
%
20 - 23
%
%
24 - 27
%
28 - 31
%
%
(Simplify your answers.)
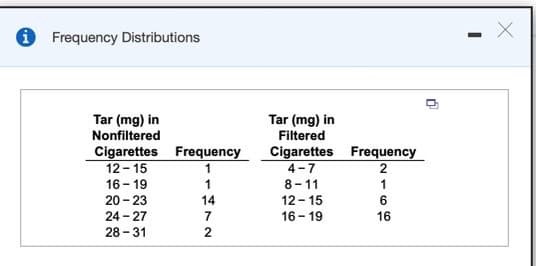
Transcribed Image Text:Frequency Distributions
Tar (mg) in
Tar (mg) in
Filtered
Nonfiltered
Cigarettes Frequency
4-7
Cigarettes Frequency
12 - 15
16 - 19
20 - 23
8-11
1
14
12 - 15
6
24 - 27
7
16 - 19
16
28 - 31
Expert Solution
Step 1
Relative frequency =

Trending now
This is a popular solution!

Step by step
Solved in 2 steps

Knowledge Booster


Learn more about
Need a deep-dive on the concept behind this application? Look no further. Learn more about this topic, statistics and related others by exploring similar questions and additional content below.Recommended textbooks for you
Glencoe Algebra 1, Student Edition, 9780079039897…
Algebra
ISBN:
9780079039897
Author:
Carter
Publisher:
McGraw Hill

Big Ideas Math A Bridge To Success Algebra 1: Stu…
Algebra
ISBN:
9781680331141
Author:
HOUGHTON MIFFLIN HARCOURT
Publisher:
Houghton Mifflin Harcourt

Holt Mcdougal Larson Pre-algebra: Student Edition…
Algebra
ISBN:
9780547587776
Author:
HOLT MCDOUGAL
Publisher:
HOLT MCDOUGAL
Glencoe Algebra 1, Student Edition, 9780079039897…
Algebra
ISBN:
9780079039897
Author:
Carter
Publisher:
McGraw Hill
Big Ideas Math A Bridge To Success Algebra 1: Stu…
Algebra
ISBN:
9781680331141
Author:
HOUGHTON MIFFLIN HARCOURT
Publisher:
Houghton Mifflin Harcourt
Holt Mcdougal Larson Pre-algebra: Student Edition…
Algebra
ISBN:
9780547587776
Author:
HOLT MCDOUGAL
Publisher:
HOLT MCDOUGAL