Consulting a physics text, you find the following formula for kinetic energy, K = ½ mv² where K is kinetic energy and v is the speed of mass m. Thus, kinetic energy is a quadratic function of the speed. The data transformation z = v² gives the formula K = ½ m z which is a linear equation between K and z with slope = ½ m and y-intercept equal to zero. Thus, theory predicts a linear relationship between K and speed squared. 3. а) Enter speed squared into your calculator or computer, plot the new data and examine the resulting graph. b) and units) on your sketch. Does the graph show a linear relationship? Make a freehand sketch of the resulting graph. Include axes labels (variable names
Consulting a physics text, you find the following formula for kinetic energy, K = ½ mv² where K is kinetic energy and v is the speed of mass m. Thus, kinetic energy is a quadratic function of the speed. The data transformation z = v² gives the formula K = ½ m z which is a linear equation between K and z with slope = ½ m and y-intercept equal to zero. Thus, theory predicts a linear relationship between K and speed squared. 3. а) Enter speed squared into your calculator or computer, plot the new data and examine the resulting graph. b) and units) on your sketch. Does the graph show a linear relationship? Make a freehand sketch of the resulting graph. Include axes labels (variable names

Functions and Change: A Modeling Approach to College Algebra (MindTap Course List)
6th Edition
ISBN:9781337111348
Author:Bruce Crauder, Benny Evans, Alan Noell
Publisher:Bruce Crauder, Benny Evans, Alan Noell
Chapter5: A Survey Of Other Common Functions
Section5.4: Combining And Decomposing Functions
Problem 8E

Related questions

Topic Video
Question
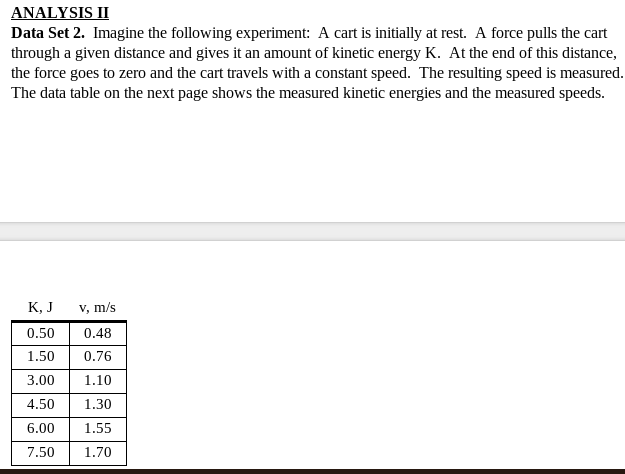
Transcribed Image Text:ANALYSIS II
Data Set 2. Imagine the following experiment: A cart is initially at rest. A force pulls the cart
through a given distance and gives it an amount of kinetic energy K. At the end of this distance,
the force goes to zero and the cart travels with a constant speed. The resulting speed is measured.
The data table on the next page shows the measured kinetic energies and the measured speeds.
K, J
v, m/s
0.50
0.48
1.50
0.76
3.00
1.10
4.50
1.30
6.00
1.55
7.50
1.70
Transcribed Image Text:3.
Consulting a physics text, you find the following formula for kinetic energy, K = ½ mv²
where K is kinetic energy and v is the speed of mass m. Thus, kinetic energy is a quadratic
function of the speed. The data transformation z = v gives the formula K = ½ m z which is a
linear equation between K and z with slope = ½ m and y-intercept equal to zero. Thus, theory
predicts a linear relationship between K and speed squared.
a)
examine the resulting graph.
Enter speed squared into your calculator or computer, plot the new data and
b)
and units) on your sketch. Does the graph show a linear relationship?
Make a freehand sketch of the resulting graph. Include axes labels (variable names
4.
Do a linear regression analysis of the data, report the resulting slope and y-intercept with
proper units, and write the explicit function. From your results, determine an experimental value
for mass m.
Plot the regression function on the same graph as your plotted data. How well does the
function fit the data?
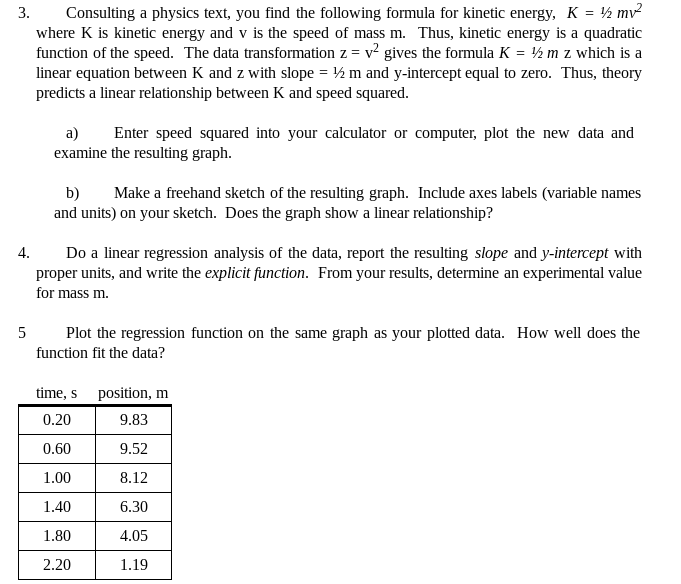
time, s position, m
0.20
9.83
0.60
9.52
1.00
8.12
1.40
6.30
1.80
4.05
2.20
1.19
Expert Solution
Step 1
As per guidelines, we will provide answer for first question only.
3)
a)
Use the given data to form excel table for kinetic energy and speed squared.
| Kinetic energy (J) | v(m/s) | |
| 0.50 | 0.48 | 0.2304 |
| 1.50 | 0.76 | 0.5776 |
| 3.00 | 1.10 | 1.21 |
| 4.50 | 1.30 | 1.69 |
| 6.00 | 1.55 | 2.4025 |
| 7.50 | 1.70 | 2.89 |
Use the graphing calculator to form graph:

Trending now
This is a popular solution!

Step by step
Solved in 3 steps with 2 images

Knowledge Booster


Learn more about
Need a deep-dive on the concept behind this application? Look no further. Learn more about this topic, statistics and related others by exploring similar questions and additional content below.Recommended textbooks for you
Functions and Change: A Modeling Approach to Coll…
Algebra
ISBN:
9781337111348
Author:
Bruce Crauder, Benny Evans, Alan Noell
Publisher:
Cengage Learning


Algebra & Trigonometry with Analytic Geometry
Algebra
ISBN:
9781133382119
Author:
Swokowski
Publisher:
Cengage
Functions and Change: A Modeling Approach to Coll…
Algebra
ISBN:
9781337111348
Author:
Bruce Crauder, Benny Evans, Alan Noell
Publisher:
Cengage Learning
Algebra & Trigonometry with Analytic Geometry
Algebra
ISBN:
9781133382119
Author:
Swokowski
Publisher:
Cengage