Consumption of Soda and Bottled Water in the United States 70 (2000, 52) 60 Soda 50 (2015, 37) 40 - 30 (2000, 16) (2015, 34) 20 Bottled Water 10 2000 2003 2006 2009 2012 2015 Year Per Capita Consumption (gallons)


Correlation
Correlation defines a relationship between two independent variables. It tells the degree to which variables move in relation to each other. When two sets of data are related to each other, there is a correlation between them.
Linear Correlation
A correlation is used to determine the relationships between numerical and categorical variables. In other words, it is an indicator of how things are connected to one another. The correlation analysis is the study of how variables are related.
Regression Analysis
Regression analysis is a statistical method in which it estimates the relationship between a dependent variable and one or more independent variable. In simple terms dependent variable is called as outcome variable and independent variable is called as predictors. Regression analysis is one of the methods to find the trends in data. The independent variable used in Regression analysis is named Predictor variable. It offers data of an associated dependent variable regarding a particular outcome.
The graphs show per capita consumption of soda and bottled water in the United States in gallons from 2000 through 2015.a. Write the slope-intercept equation of the line that models soda consumption per capita, y, in gallons, x years after 2000.b. Write the slope-intercept equation of the line that models bottled water consumption per capita, y, in gallons, x years after 2000.c.Use the models from part (a) and (b) to determine the year, to the nearest whole year, during which per capita soda consumption was the same as per capita water consumption.
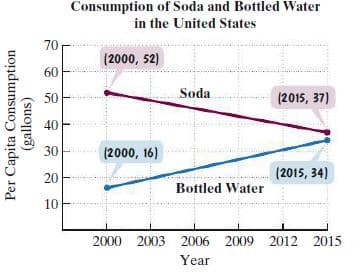
We have the graph which is showing per capita consumption of soda and bottled water in the United States in gallons from 2000 through 2015
(a) We have to write the slope-intercept equation of the line that models soda consumption per capita, y, in gallons, x years after 2000
(b) Write the slope-intercept equation of the line that models bottled water consumption per capita, y, in gallons, x years after 2000
(c) after that, we will use the models from part (a) and (b) to determine the year, to the nearest whole year, during which per capita soda consumption was the same as per capita water consumption.
(a)
We have two points
Here, y-axis is in gallons and x-axis in years.
We can find the slope m by

Therefore,

Now, take the equation of the line that model soda consumption per capita
We have the initial point in the x-axis is 0 since
and m=-1

So, the equation of the line that tells soda consumption is

Trending now
This is a popular solution!

Step by step
Solved in 4 steps with 7 images


