What is Correlation?
A correlation is used to determine the relationships between numerical and categorical variables. In other words, it is an indicator of how things are connected to one another. The correlation analysis is the study of how variables are related.
Correlation analysis can help improve predictions by identifying explanatory variables that are strongly related to the response variable. Assume we want to estimate the number of hours it will take to perform an audit on a client. One explanatory variable could be the monetary value of the client’s assets.
Correlation statistics have applications in finance and investing. A correlation coefficient, for example, could be evaluated to determine the level of correlation between crude oil prices and the stock price of an oil-producing company, such as Exxon Mobil Corporation. Because the oil companies earn more profit as oil prices rise, the correlation between the two variables is strong.
Correlation Coefficient
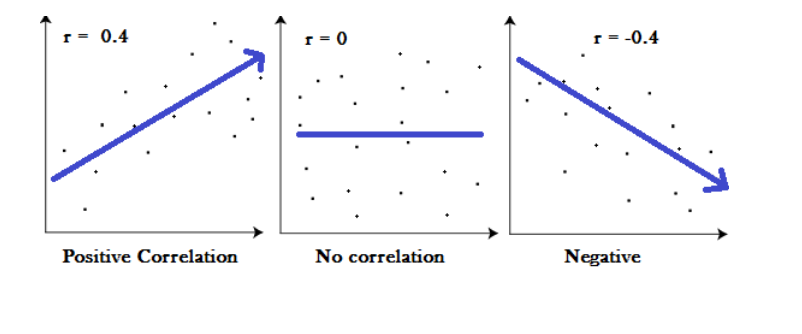
The correlation coefficients are used to assess the strength of a relationship between two variables. A correlation coefficient is a method of putting a monetary value on a relationship. Correlation coefficients range between -1 and 1. A “0” correlation indicates that there is no relationship between the variables, whereas a “-1” or “1” correlation indicates that there is a perfect negative or positive correlation.
The two variables are frequently denoted by the symbols X and Y. To show how the two variables are related, the values of X and Y are depicted by drawing a scatter diagram and the visualization combinations of the two variables. The scatter plot explains the relationship between the two variables or attributes. It indicates the degree to which the two variables are linked. There are three such scenarios that can be used to examine the relationship between the two variables. The following graph will show the relationship.
Correlation Coefficient Equation
The correlation coefficient is denoted by ρ and is calculated by dividing the covariance by the product of the standard deviations of the two variables.
ρ (X,Y) = Cov (X,Y) / σX σY
ρxy=Pearson product-moment correlation coefficient
Cov(x,y)=Covariance of variables x and y
σx=Standard deviation of x
σy=Standard deviation of y
The standard deviation is a measure of how far data deviates from its mean. The magnitude of covariance, which is a measure of how two variables change together, is unbounded.
Correlation
There are different types of Correlation coefficients. Some of them listed below.
- Pearson Correlation Coefficient.
- Spearman rank correlation
- Kendall rank correlation.
- Point-Biserial correlation.
Pearson Correlation Coefficient
Karl Pearson, the founder of the mathematical statistics discipline, inspired the name correlation. It is regarded as a simple linear correlation. Pearson's correlation is a measure of linear correlation.
Linear correlation describes the relationship between two variables in a straight line. Linear correlation is a measure of dependence between two random variables, with values ranging from -1 to 1. It is proportional to covariance and has a very similar interpretation to covariance.
Pearson's correlation coefficient for a sample of n pairs (x,y) of numbers is the number r given by the formula:
Where
- “n” denotes the number of observations and “xi” and “yi” denote the variables.
- The value of r ranges from -1 to 1, inclusive.
- The direction of the linear relationship between x and y is indicated by the sign of r.
- The magnitude of |r| denotes the strength of the linear relationship between x and y:
- If |r| is close to 1 (that is if r is close to either 1 or -1 ), then the linear relationship between x and y is strong.
- If |r| is close to zero (that is if r is near 0 and of either sign), then the linear relationship between x and y is weak.
Pearson Correlation and Linear Regression
If two numerical variables are significantly linearly related, a correlation or simple linear regression analysis can be used to determine this. A correlation method gives the information on the strength and direction of a linear relationship between two variables, whereas a simple linear regression analysis estimates parameters in a linear equation that can be used to predict the value of one variable based on the other variables.
Confidence Interval
In statistics, a confidence interval denotes the likelihood that a population parameter will drop between a set of values for a certain proportion of the time. The degree of uncertainty or certainty in a sampling method is measured by confidence intervals. They can be chosen from a variety of probability limits, the most common of which are 95 percent or 99 percent confidence levels. A confidence interval is a set of values bounded above and below the mean of a statistic that is likely to contain an unknown population parameter.
Significance Test
A t-test is an inferential statistic that is used to see if there is a significant difference in the means of two groups that are related in some way. It is frequently used in hypothesis testing to evaluate whether a process or treatment has an effect on the population of interest, or whether two groups differ.
P-value Significance- The p-value in statistics is the possibility of getting results that are at least as extreme as the observed results of a statistical hypothesis test, assuming that the null hypothesis is correct. The p-value is used instead of rejection points to provide the smallest level of significance at which the null hypothesis is rejected. A lower p-value indicates that there is stronger evidence in favour of the alternative hypothesis.
The p-value is calculated mathematically using integral calculus from the area under the probability distribution curve for all statistics values that are at least as far from the reference value as the observed value is, relative to the total area under the probability distribution curve.
T Distribution-It is a type of probability distribution with a bell shape that is similar to the normal distribution but has heavier tails. The t-distributions have a higher chance of containing extreme values than the normal distributions, resulting in fatter tails. The t-distribution is used in a variety of commonly used statistical analyses, including the Student's t-test for determining the statistical significance of a difference between two sample means, the construction of confidence intervals for a difference between two population means, and linear regression analysis.
Regression Analysis- Regression analysis is a set of statistical techniques for calculating relationships between one or more independent variables and a dependent variable. It can be used to assess the strength of the relationship between variables and to forecast their future relationship. Various models are used in regression analysis which are listed below.
- Linear Regression
- Logistic Regression
- Ridge Regression
- Lasso Regression
- Polynomial Regression
- Bayesian Linear Regression
Formula
- The formula for the Pearson’s correlation is ρ (X,Y) = Cov (X,Y) / σX σY, where ρxy is the Pearson product-moment correlation coefficient, Cov(x,y) is the covariance of variables x and y, σx is the standard deviation of x and σy is the standard deviation of y.
- The formula for Pearson's correlation coefficient for a sample of n pairs (x,y) of numbers is , where “n” denotes the number of observations and “xi” and “yi” denote the variables.
Common Mistakes
- One common mistake is assuming that correlation implies causation. It is not appropriate to indicate a causal relationship between two variables based solely on their strong correlation coefficient.
- One common misunderstanding when evaluating correlation is that it indicates a linear relationship between the variables of interest.
- Another common error in correlation is over-generalization.
Context & Applications
- Correlation is important because it enables you to predict future behavior if you know what relationship the variables possess. Knowing what the future holds is essential in social sciences such as government and healthcare.
- These statistics are also used by businesses to create budgets and business plans.
- The linear correlation is most widely used in statistical procedures and serves as the foundation for many applications such as exploratory data analysis, structural modeling, data engineering, and so on.
Related Concepts
- Hypothesis Testing
- Poisson Distribution
Want more help with your statistics homework?
*Response times may vary by subject and question complexity. Median response time is 34 minutes for paid subscribers and may be longer for promotional offers.
Search. Solve. Succeed!
Study smarter access to millions of step-by step textbook solutions, our Q&A library, and AI powered Math Solver. Plus, you get 30 questions to ask an expert each month.
Linear Correlation Homework Questions from Fellow Students
Browse our recently answered Linear Correlation homework questions.
Search. Solve. Succeed!
Study smarter access to millions of step-by step textbook solutions, our Q&A library, and AI powered Math Solver. Plus, you get 30 questions to ask an expert each month.