COST-BENEFIT ANALYSIS Listed in the diagram for Problem 7 are some probability estimates of the costs and benefits associated with two competing projects. a. Compute the net present value of each alternative. Round the cost projections to the nearest month. b. Repeat step (a) for the payback method. c. Which method do you think provides the best source of information? Why? PROBLEM 7: CosT-BENEFIT AMALYSIS COST OF CAPITAL = .14 Probability Amount Probability Amount Project completion time 0.5 0.3 0.2 12 months 18 months 24 months 4 years 5 years 6 years $200,000 250,000 300,000 $ 75,000 95,000 105,000 0.6 12 months 0.2 18 months 0.1 24 months 4 years 5 years 6 years $210,000 250,000 260,000 $ 85,000 100,000 110,000 Expected useful ife 0.6 0.5 0.25 0.3 0.2 0.15 0.35 One-time costs 0.2 0.4 0.55 0.25 0.25 Recurring costs 0.1 0.4 0.55 0.35 0.4 0.2 Annual tangible benefits starting with weighted average completion date 0.3 0.5 0.2 $220,000 233,000 240,000 0.25 0.5 0.25 $215,000 225,000 235,000
COST-BENEFIT ANALYSIS Listed in the diagram for Problem 7 are some probability estimates of the costs and benefits associated with two competing projects. a. Compute the net present value of each alternative. Round the cost projections to the nearest month. b. Repeat step (a) for the payback method. c. Which method do you think provides the best source of information? Why? PROBLEM 7: CosT-BENEFIT AMALYSIS COST OF CAPITAL = .14 Probability Amount Probability Amount Project completion time 0.5 0.3 0.2 12 months 18 months 24 months 4 years 5 years 6 years $200,000 250,000 300,000 $ 75,000 95,000 105,000 0.6 12 months 0.2 18 months 0.1 24 months 4 years 5 years 6 years $210,000 250,000 260,000 $ 85,000 100,000 110,000 Expected useful ife 0.6 0.5 0.25 0.3 0.2 0.15 0.35 One-time costs 0.2 0.4 0.55 0.25 0.25 Recurring costs 0.1 0.4 0.55 0.35 0.4 0.2 Annual tangible benefits starting with weighted average completion date 0.3 0.5 0.2 $220,000 233,000 240,000 0.25 0.5 0.25 $215,000 225,000 235,000

Financial Management: Theory & Practice
16th Edition
ISBN:9781337909730
Author:Brigham
Publisher:Brigham
Chapter7: Corporate Valuation And Stock Valuation
Section: Chapter Questions
Problem 26SP

Related questions
Question
100%
Hello! Happy Sunday! Can you please help me with this problem? Me and my friends are having difficulties answering this problem.Thank you so much!
*COST-BENEFIT ANALYSIS
Listed in the diagram are some probability estimates of the costs and benefits associated with two competing projects.
a. Compute the
b. Repeat step (a) for the payback method. c. Which method do you think provides the best source of information? Why?
Transcribed Image Text:DAYBACK
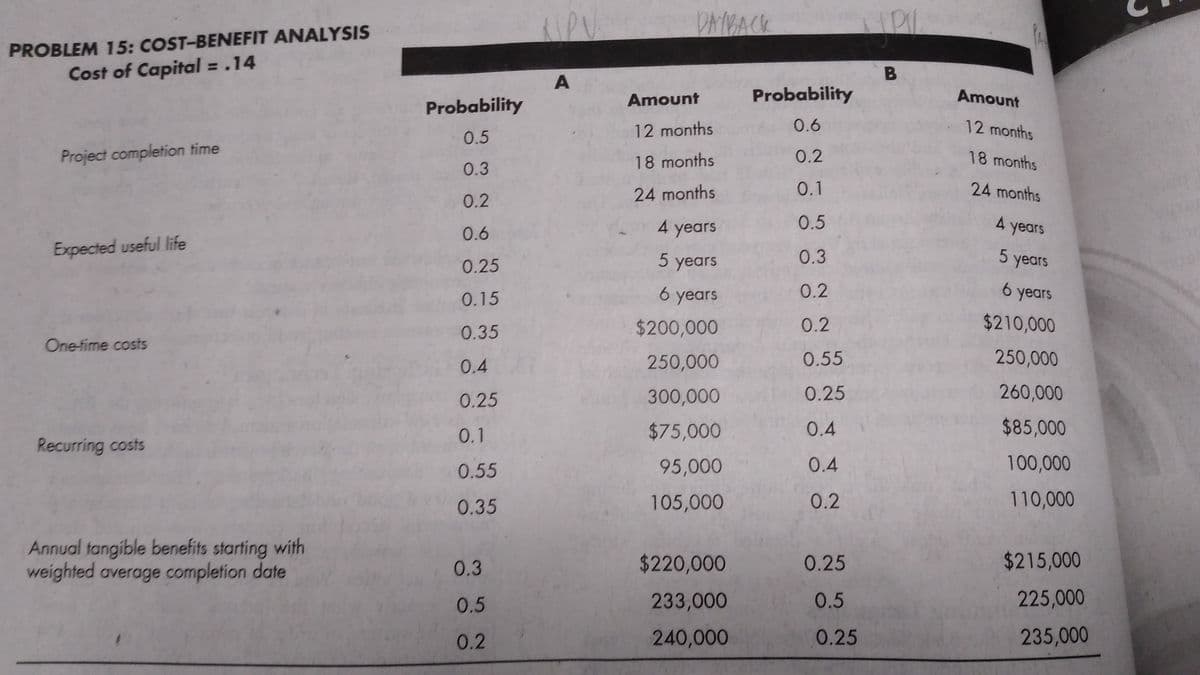
PROBLEM 15: COST-BENEFIT ANALYSIS
%3D
Cost of Capital = .14
B
Amount
Probability
Amount
Probability
12 months
0.6
12 months
0.5
Project completion time
0.2
18 months
18 months
0.3
24 months
0.1
24 months
0.2
0.6
4 years
0.5
4
4 years
Expected useful life
5 years
0.25
5 years
0.3
0.15
6 years
0.2
6.
6 years
$200,000
0.2
$210,000
0.35
One-fime costs
0.4
250,000
0.55
250,000
0.25
300,000
0.25
260,000
0.1
$75,000
0.4
$85,000
Recurring costs
0.55
95,000
0.4
100,000
0.35
105,000
0.2
110,000
Annual tangible benefits starting with
weighted average completion date
0.3
$220,000
0.25
$215,000
0.5
233,000
0.5
225,000
0.2
240,000
0.25
235,000
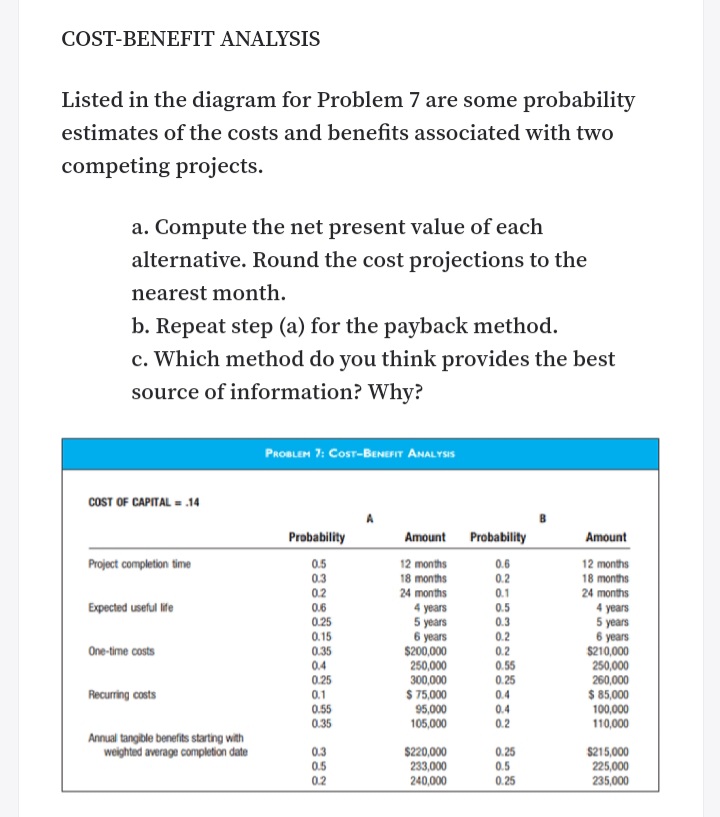
Transcribed Image Text:COST-BENEFIT ANALYSIS
Listed in the diagram for Problem 7 are some probability
estimates of the costs and benefits associated with two
competing projects.
a. Compute the net present value of each
alternative. Round the cost projections to the
nearest month.
b. Repeat step (a) for the payback method.
c. Which method do you think provides the best
source of information? Why?
PROBLEM 7: Cosr-BENEFIT ANALYSIS
COST OF CAPITAL = .14
Probability
Amount Probability
Amount
0.5
0.3
0.2
0.6
12 months
18 months
24 months
4 years
5 years
6 years
$210,000
250,000
260,000
$ 85,000
100,000
110,000
Project completion time
12 months
18 months
0.2
24 months
4 years
5 years
6 years
$200,000
250,000
300,000
$ 75,000
95,000
105,000
0.1
Expected useful ife
0.6
0.5
0.25
0.15
0.35
0.3
0.2
0.2
0.55
0.25
0.4
0.4
0.2
One-time costs
04
0.25
Recurring costs
0.1
0.55
0.35
Annual tangible benefits starting with
weighted average completion date
0.3
0.5
0.2
$220,000
233,000
240,000
0.25
0.5
0.25
$215,000
225,000
235,000
Expert Solution
This question has been solved!
Explore an expertly crafted, step-by-step solution for a thorough understanding of key concepts.

This is a popular solution!

Trending now
This is a popular solution!

Step by step
Solved in 4 steps

Follow-up Questions
Read through expert solutions to related follow-up questions below.
Knowledge Booster


Learn more about
Need a deep-dive on the concept behind this application? Look no further. Learn more about this topic, accounting and related others by exploring similar questions and additional content below.Recommended textbooks for you