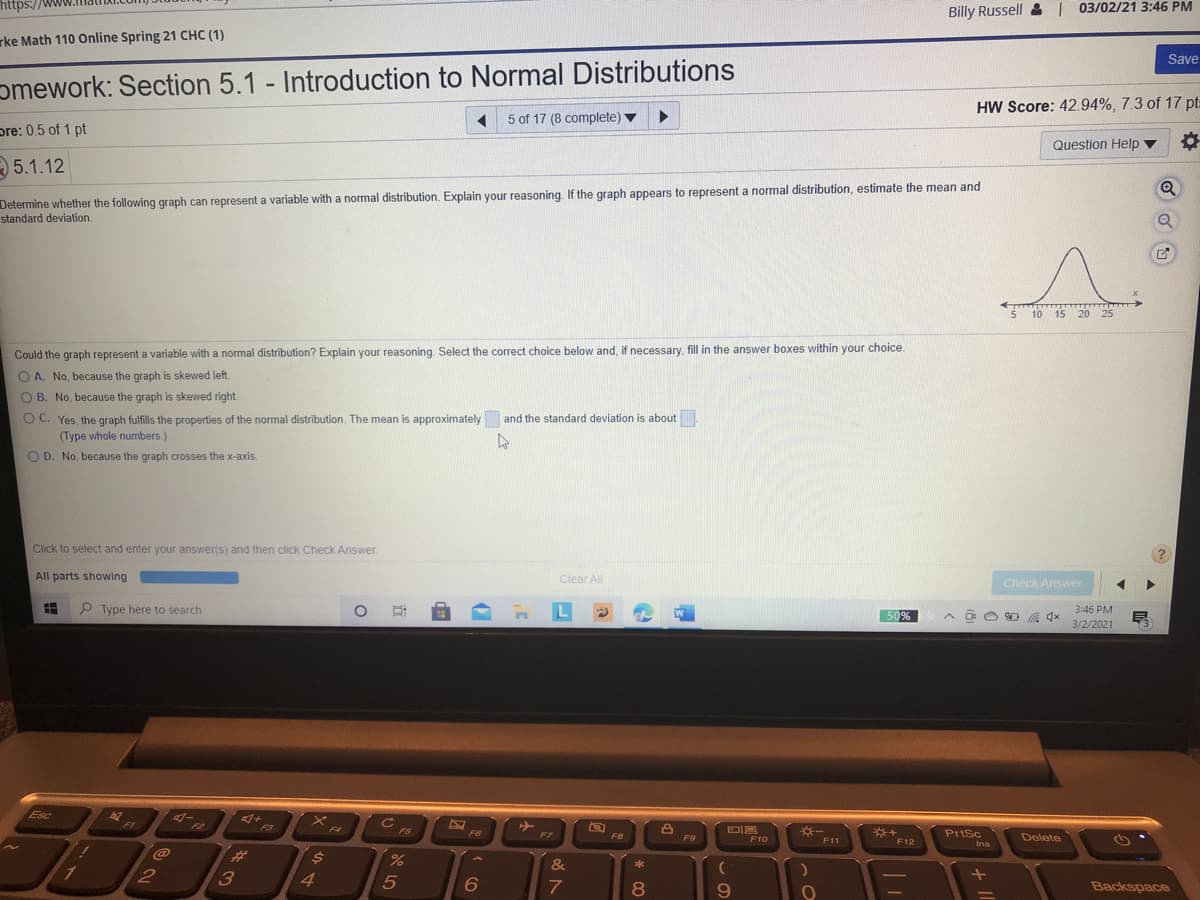
Could the graph represent a variable with a normal distribution? Explain your reasoning. Select the correct choice below and, if necessary, fill in the answer boxes within your choice. O A. No, because the graph is skewed left. O B. No, because the graph is skewed right O C. Yes, the graph fulfills the properties of the normal distribution. The mean is approximately and the standard deviation is about (Type whole numbers.) O D. No, because the graph crosses the x-axis


Inverse Normal Distribution
The method used for finding the corresponding z-critical value in a normal distribution using the known probability is said to be an inverse normal distribution. The inverse normal distribution is a continuous probability distribution with a family of two parameters.
Mean, Median, Mode
It is a descriptive summary of a data set. It can be defined by using some of the measures. The central tendencies do not provide information regarding individual data from the dataset. However, they give a summary of the data set. The central tendency or measure of central tendency is a central or typical value for a probability distribution.
Z-Scores
A z-score is a unit of measurement used in statistics to describe the position of a raw score in terms of its distance from the mean, measured with reference to standard deviation from the mean. Z-scores are useful in statistics because they allow comparison between two scores that belong to different normal distributions.


Trending now
This is a popular solution!

Step by step
Solved in 2 steps


