Country A Country B Population (millions) 144 82 Crude birth rate (number of live births per 1,000 people per year) 43 8 Crude death rate (number of deaths per 1,000 people per year) 18 10 Infant mortality rate (number of babies per 1,000 bom who die in first year of life) 100 3.8 Total fertity rate (average number of children born to women during their childbearing years) 5.9 13 % of population under 15 years old 45 14 % of population older than 65 years 19 Average life expectancy at birth 47 79 % urban 44 75 00
Country A Country B Population (millions) 144 82 Crude birth rate (number of live births per 1,000 people per year) 43 8 Crude death rate (number of deaths per 1,000 people per year) 18 10 Infant mortality rate (number of babies per 1,000 bom who die in first year of life) 100 3.8 Total fertity rate (average number of children born to women during their childbearing years) 5.9 13 % of population under 15 years old 45 14 % of population older than 65 years 19 Average life expectancy at birth 47 79 % urban 44 75 00

Case Studies In Health Information Management
3rd Edition
ISBN:9781337676908
Author:SCHNERING
Publisher:SCHNERING
Chapter7: Healthcare Statistics And Research Methods
Section: Chapter Questions
Problem 7.22.1C

Related questions

Question
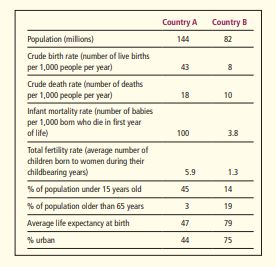
The chart below shows selected population data for two
different countries, A and B. Study the chart and answer
the questions that follow
Calculate the rates of natural increase (due to births
and deaths, not counting immigration) for the populations of country A and country B. Based on these
calculations and the data in the table, for each of the
countries, suggest whether it is a more-developed
country or a less-developed country and explain the
reasons for your answers
Transcribed Image Text:Country A
Country B
Population (millions)
144
82
Crude birth rate (number of live births
per 1,000 people per year)
43
8
Crude death rate (number of deaths
per 1,000 people per year)
18
10
Infant mortality rate (number of babies
per 1,000 bom who die in first year
of life)
100
3.8
Total fertity rate (average number of
children born to women during their
childbearing years)
5.9
13
% of population under 15 years old
45
14
% of population older than 65 years
19
Average life expectancy at birth
47
79
% urban
44
75
00
Expert Solution
This question has been solved!
Explore an expertly crafted, step-by-step solution for a thorough understanding of key concepts.

This is a popular solution!

Trending now
This is a popular solution!

Step by step
Solved in 2 steps

Knowledge Booster


Learn more about
Need a deep-dive on the concept behind this application? Look no further. Learn more about this topic, biology and related others by exploring similar questions and additional content below.Recommended textbooks for you
Case Studies In Health Information Management
Biology
ISBN:
9781337676908
Author:
SCHNERING
Publisher:
Cengage

Nutrition Through The Life Cycle
Health & Nutrition
ISBN:
9781337919333
Author:
Brown, Judith E.
Publisher:
Cengage Learning,

Biology: The Unity and Diversity of Life (MindTap…
Biology
ISBN:
9781337408332
Author:
Cecie Starr, Ralph Taggart, Christine Evers, Lisa Starr
Publisher:
Cengage Learning
Case Studies In Health Information Management
Biology
ISBN:
9781337676908
Author:
SCHNERING
Publisher:
Cengage
Nutrition Through The Life Cycle
Health & Nutrition
ISBN:
9781337919333
Author:
Brown, Judith E.
Publisher:
Cengage Learning,
Biology: The Unity and Diversity of Life (MindTap…
Biology
ISBN:
9781337408332
Author:
Cecie Starr, Ralph Taggart, Christine Evers, Lisa Starr
Publisher:
Cengage Learning
Essentials Health Info Management Principles/Prac…
Health & Nutrition
ISBN:
9780357191651
Author:
Bowie
Publisher:
Cengage

Biology: The Dynamic Science (MindTap Course List)
Biology
ISBN:
9781305389892
Author:
Peter J. Russell, Paul E. Hertz, Beverly McMillan
Publisher:
Cengage Learning