Country Italy Italy Italy Italy Italy Italy Japan Japan Japan Japan Japan Japan Year 2000 2010 2020 2030 2040 2050 2000 2010 2020 2030 2040 2050 Population 57,784,371 60,786,485 61,337,765 60,840,335 61,012,899 61,036,680 126,771,901 127,645,939 125,135,727 119,732,022 113,086,546 106,156,887 Annual Growth Rate % 0.27 0.58 -0.26 0.00 0.04 -0.05 0.23 -0.06 -0.35 -0.52 -0.61 -0.65 Total Fertility Rate 1.24 1.37 1.19 1.36 1.53 1.70 1.37 1.39 1.37 1.45 1.52 1.60 Infant Mortality Rate, Both Sexes 4.29 3.34 3.43 2.80 2.42 2.11 3.35 2.40 1.94 1.74 1.57 1.43 Crude Birth Rate 9.40 9.24 6.86 7.55 8.42 8.46 9.64 8.79 7.06 6.87 7.12 6.90 Net Crude Death Migration Rate Rate 9.61 9.66 12.16 11.15 11.54 12.52 7.66 9.35 11.29 12.78 13.93 14.09 Jala 2.95 6.25 2.67 3.56 3.55 3.54 0.30 0.00 0.75 0.72 0.70 0.68 Life Expectancy at Birth, Both Sexes 79.61 81.79 81.55 84.14 85.89 87.45 81.03 82.83 84.47 86.19 87.72 89.07
Country Italy Italy Italy Italy Italy Italy Japan Japan Japan Japan Japan Japan Year 2000 2010 2020 2030 2040 2050 2000 2010 2020 2030 2040 2050 Population 57,784,371 60,786,485 61,337,765 60,840,335 61,012,899 61,036,680 126,771,901 127,645,939 125,135,727 119,732,022 113,086,546 106,156,887 Annual Growth Rate % 0.27 0.58 -0.26 0.00 0.04 -0.05 0.23 -0.06 -0.35 -0.52 -0.61 -0.65 Total Fertility Rate 1.24 1.37 1.19 1.36 1.53 1.70 1.37 1.39 1.37 1.45 1.52 1.60 Infant Mortality Rate, Both Sexes 4.29 3.34 3.43 2.80 2.42 2.11 3.35 2.40 1.94 1.74 1.57 1.43 Crude Birth Rate 9.40 9.24 6.86 7.55 8.42 8.46 9.64 8.79 7.06 6.87 7.12 6.90 Net Crude Death Migration Rate Rate 9.61 9.66 12.16 11.15 11.54 12.52 7.66 9.35 11.29 12.78 13.93 14.09 Jala 2.95 6.25 2.67 3.56 3.55 3.54 0.30 0.00 0.75 0.72 0.70 0.68 Life Expectancy at Birth, Both Sexes 79.61 81.79 81.55 84.14 85.89 87.45 81.03 82.83 84.47 86.19 87.72 89.07

Case Studies In Health Information Management
3rd Edition
ISBN:9781337676908
Author:SCHNERING
Publisher:SCHNERING
Chapter6: Leadership
Section: Chapter Questions
Problem 6.41.1C

Related questions
Question
100%
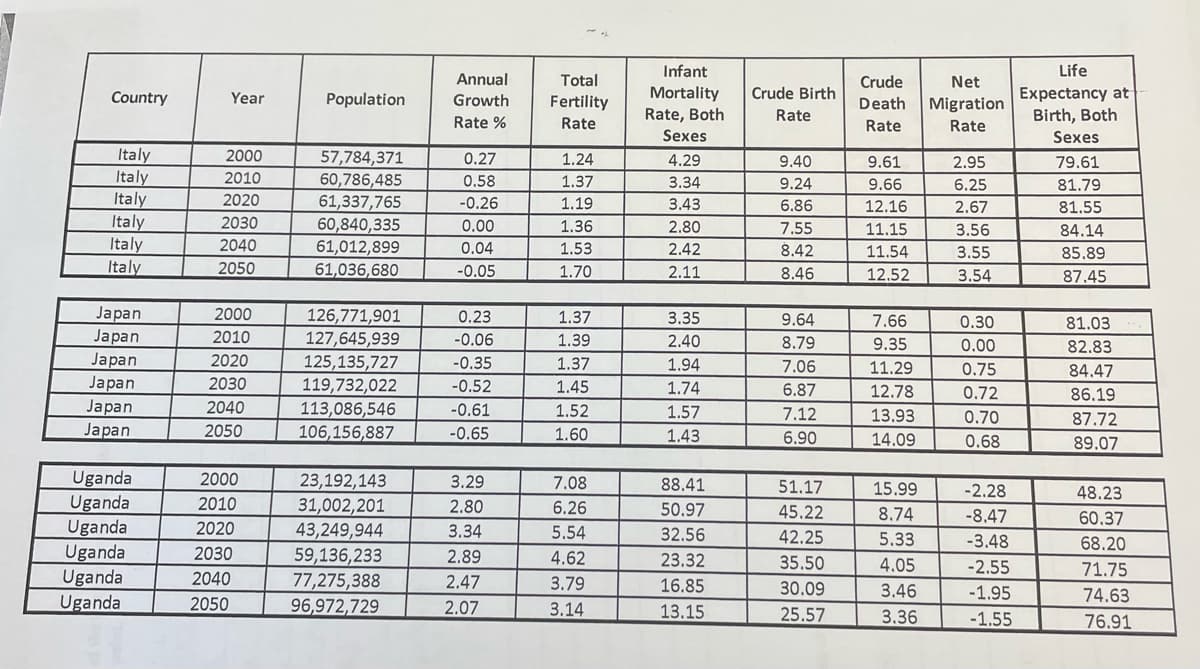
Graph the population of all three countries for the years shown in the table
(Table is in the Image)
Transcribed Image Text:Country
Italy
Italy
Italy
Italy
Italy
Italy
Japan
Japan
Japan
Japan
Japan
Japan
Uganda
Uganda
Uganda
Uganda
Uganda
Uganda
Year
2000
2010
2020
2030
2040
2050
2000
2010
2020
2030
2040
2050
2000
2010
2020
2030
2040
2050
Population
57,784,371
60,786,485
61,337,765
60,840,335
61,012,899
61,036,680
126,771,901
127,645,939
125,135,727
119,732,022
113,086,546
106,156,887
23,192,143
31,002,201
43,249,944
59,136,233
77,275,388
96,972,729
Annual
Growth
Rate %
0.27
0.58
-0.26
0.00
0.04
-0.05
0.23
-0.06
-0.35
-0.52
-0.61
-0.65
3.29
2.80
3.34
2.89
2.47
2.07
Total
Fertility
Rate
1.24
1.37
1.19
1.36
1.53
1.70
1.37
1.39
1.37
1.45
1.52
1.60
7.08
6.26
5.54
4.62
3.79
3.14
Infant
Mortality
Rate, Both
Sexes
4.29
3.34
3.43
2.80
2.42
2.11
3.35
2.40
1.94
1.74
1.57
1.43
88.41
50.97
32.56
23.32
16.85
13.15
Crude Birth
Rate
9.40
9.24
6.86
7.55
8.42
8.46
9.64
8.79
7.06
6.87
7.12
6.90
51.17
45.22
42.25
35.50
30.09
25.57
Net
Crude
Death Migration
Rate
Rate
9.61
9.66
12.16
11.15
11.54
12.52
7.66
9.35
11.29
12.78
13.93
14.09
15.99
8.74
5.33
4.05
3.46
3.36
2.95
6.25
2.67
3.56
3.55
3.54
0.30
0.00
0.75
0.72
0.70
0.68
-2.28
-8.47
-3.48
-2.55
-1.95
-1.55
Life
Expectancy at
Birth, Both
Sexes
79.61
81.79
81.55
84.14
85.89
87.45
81.03
82.83
84.47
86.19
87.72
89.07
48.23
60.37
68.20
71.75
74.63
76.91
Expert Solution
This question has been solved!
Explore an expertly crafted, step-by-step solution for a thorough understanding of key concepts.

Step by step
Solved in 2 steps with 2 images

Recommended textbooks for you
Case Studies In Health Information Management
Biology
ISBN:
9781337676908
Author:
SCHNERING
Publisher:
Cengage

Principles Of Radiographic Imaging: An Art And A …
Health & Nutrition
ISBN:
9781337711067
Author:
Richard R. Carlton, Arlene M. Adler, Vesna Balac
Publisher:
Cengage Learning
Case Studies In Health Information Management
Biology
ISBN:
9781337676908
Author:
SCHNERING
Publisher:
Cengage
Principles Of Radiographic Imaging: An Art And A …
Health & Nutrition
ISBN:
9781337711067
Author:
Richard R. Carlton, Arlene M. Adler, Vesna Balac
Publisher:
Cengage Learning
Essentials Health Info Management Principles/Prac…
Health & Nutrition
ISBN:
9780357191651
Author:
Bowie
Publisher:
Cengage

Biology: The Dynamic Science (MindTap Course List)
Biology
ISBN:
9781305389892
Author:
Peter J. Russell, Paul E. Hertz, Beverly McMillan
Publisher:
Cengage Learning