County who have Covid-19 antibodies. A random sample of 8023 Los Angeles County residents found that 1430 have Covid-19 antibodies. a) Determine the minimum sample size needed to estimate, with 99% confidence, the population proportion of Los Angeles County residents who have Covid-19 antibodies if the estimate must be accurate within 1% of the population proportion. b) Find a 90% confidence interval for the population proportion of Los Angeles County residents who have Covid-19 antibodies. Explain the answer in the context of the problem.
County who have Covid-19 antibodies. A random sample of 8023 Los Angeles County residents found that 1430 have Covid-19 antibodies. a) Determine the minimum sample size needed to estimate, with 99% confidence, the population proportion of Los Angeles County residents who have Covid-19 antibodies if the estimate must be accurate within 1% of the population proportion. b) Find a 90% confidence interval for the population proportion of Los Angeles County residents who have Covid-19 antibodies. Explain the answer in the context of the problem.

Holt Mcdougal Larson Pre-algebra: Student Edition 2012
1st Edition
ISBN:9780547587776
Author:HOLT MCDOUGAL
Publisher:HOLT MCDOUGAL
Chapter11: Data Analysis And Probability
Section11.5: Interpreting Data
Problem 1C

Related questions

Question
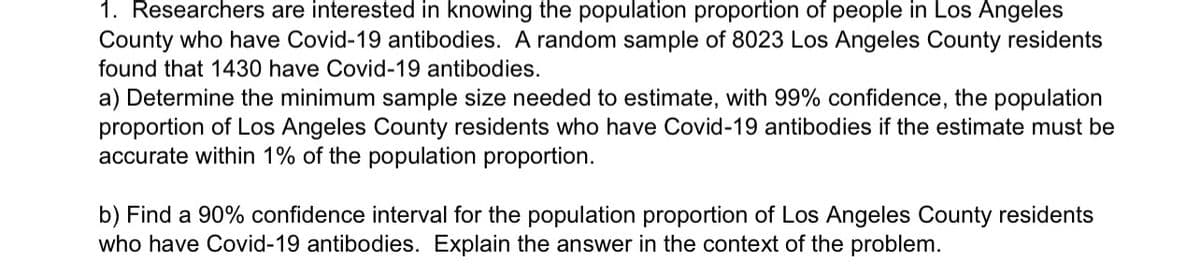
Transcribed Image Text:1. Researchers are interested in knowing the population proportion of people in Los Angeles
County who have Covid-19 antibodies. A random sample of 8023 Los Angeles County residents
found that 1430 have Covid-19 antibodies.
a) Determine the minimum sample size needed to estimate, with 99% confidence, the population
proportion of Los Angeles County residents who have Covid-19 antibodies if the estimate must be
accurate within 1% of the population proportion.
b) Find a 90% confidence interval for the population proportion of Los Angeles County residents
who have Covid-19 antibodies. Explain the answer in the context of the problem.
Expert Solution
This question has been solved!
Explore an expertly crafted, step-by-step solution for a thorough understanding of key concepts.

Step by step
Solved in 2 steps with 3 images

Knowledge Booster


Learn more about
Need a deep-dive on the concept behind this application? Look no further. Learn more about this topic, statistics and related others by exploring similar questions and additional content below.Recommended textbooks for you
Holt Mcdougal Larson Pre-algebra: Student Edition…
Algebra
ISBN:
9780547587776
Author:
HOLT MCDOUGAL
Publisher:
HOLT MCDOUGAL
Holt Mcdougal Larson Pre-algebra: Student Edition…
Algebra
ISBN:
9780547587776
Author:
HOLT MCDOUGAL
Publisher:
HOLT MCDOUGAL