Create a scatter plot for the following. 15 17 40 40 X у 19 38 O positive correlation O negative correlation 20 35 20 31 21 32 If there is correlation in the population would it positive or negative correlation? 222 28 22 25 23 25
Create a scatter plot for the following. 15 17 40 40 X у 19 38 O positive correlation O negative correlation 20 35 20 31 21 32 If there is correlation in the population would it positive or negative correlation? 222 28 22 25 23 25

Glencoe Algebra 1, Student Edition, 9780079039897, 0079039898, 2018
18th Edition
ISBN:9780079039897
Author:Carter
Publisher:Carter
Chapter4: Equations Of Linear Functions
Section4.5: Correlation And Causation
Problem 27PFA

Related questions
Question
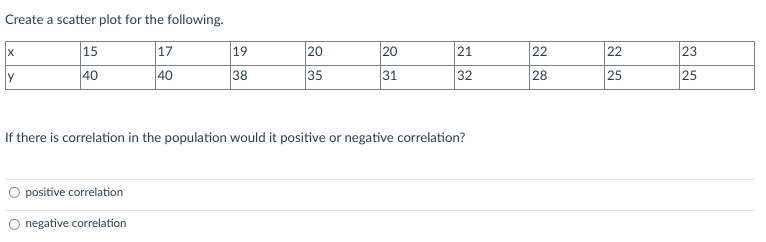
Transcribed Image Text:Create a scatter plot for the following.
17
40
X
y
15
40
19
38
positive correlation
negative correlation
20
35
20
31
21
32
If there is correlation in the population would it positive or negative correlation?
22
28
22
25
23
25
Expert Solution
This question has been solved!
Explore an expertly crafted, step-by-step solution for a thorough understanding of key concepts.

Step by step
Solved in 3 steps with 1 images

Recommended textbooks for you
Glencoe Algebra 1, Student Edition, 9780079039897…
Algebra
ISBN:
9780079039897
Author:
Carter
Publisher:
McGraw Hill

Big Ideas Math A Bridge To Success Algebra 1: Stu…
Algebra
ISBN:
9781680331141
Author:
HOUGHTON MIFFLIN HARCOURT
Publisher:
Houghton Mifflin Harcourt
Glencoe Algebra 1, Student Edition, 9780079039897…
Algebra
ISBN:
9780079039897
Author:
Carter
Publisher:
McGraw Hill
Big Ideas Math A Bridge To Success Algebra 1: Stu…
Algebra
ISBN:
9781680331141
Author:
HOUGHTON MIFFLIN HARCOURT
Publisher:
Houghton Mifflin Harcourt