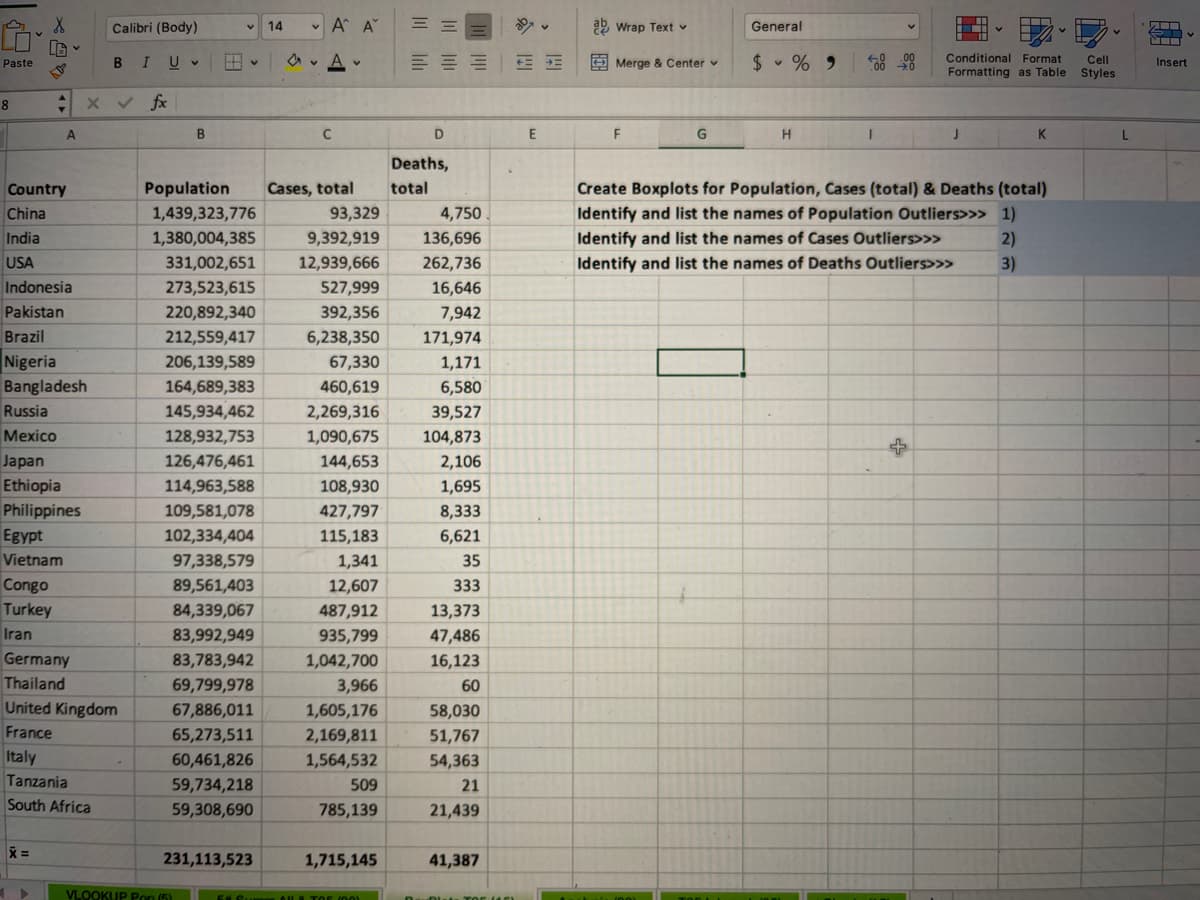
Create Boxplots for Population, Cases (total) & Deaths (total) Identify and list the names of Population Outliers>>> 1) Identify and list the names of Cases Outliers>> 2) Identify and list the names of Deaths Outliers>>> 3)
Q: What two characteristics can an outlier affect?
A: An outlier is an observation that lies an abnormal distance from other values in a random sample…
Q: Find the q1,q2,q3 and interquartile range and identify any outliers from the data set below. 57, 62,…
A:
Q: Describe the sampling distribution of the sample proportion when large samples are drawn.
A: Hello! As you have posted 3 different questions, we are answering the first question. In case you…
Q: How many outliers are there in a data set? 1,2,4,8,16,32,64.128,256,412,1024.
A: Given the data set as 1, 2, 4, 8, 16, 32, 64, 128, 256, 412, 1024.
Q: a frequency table of grades had five classes (A,B,C,D,E,F) with frequencies of of 2,13,13,5 and 2…
A:
Q: Choose the scatter point in which the outlier is highlighted.
A: Outlier : It is an observation that lies at an abnormal distance from other values in a random…
Q: The five number summary of a dataset was found to be: 1, 3, 10, 15, 17 An observation is considered…
A: According to the provided information, the five-number summary of the data set is 1, 3, 10, 15, 17…
Q: . Give the Five-Number Summary and test for Outliers: 1, 5, 8, 10, 11, 12, 13, 18, 19, 20, 28, 38,…
A:
Q: create a histogram and a boxplot. Are there any outliers? Is the data skewed? How? slove within 30…
A: Sample Sample(x1) 1 2.54 2 1.61 3 1.85 4 2.38 5 1.78 6 2.11 7 4.84 8 1.19 9 1.77…
Q: 2) Is there any outlier in the data set X? Use Dixon Outlier method and box-plot technique and…
A: Given data, Midterm result (X) 42 90 65 70 41 58 56 20 53 2
Q: Using the IQR definition of outliers, how many outliers are in this data set? Find the lower fence…
A: Formula for lower fence: Lower fence=Q1-1.5IQR Formula for upper fence: Upper fence=Q3+1.5IQR…
Q: The five number summary of a dataset was found to be: 1, 9, 13, 15, 18 An observation is considered…
A: Given 5 number summary 1, 9, 13, 15, 18 An observation is considered an outlier if it is below: 1
Q: If the five numbers summary of the data are : -14 , 0 , 2 , 3 , 10 then the lower outlier limit =
A: We have given that the data, 14, 0, 2, 3, 10 Then, We will find the lower outlier limit = ?
Q: Find a sample size for which the median will always equal one of the values in the sample.
A: Median: The median is the middle-most observation in an ordered (in an ascending or descending…
Q: the sticker prices ( in dollars) of 11 vehicles at a car dealership are listed 39144, 40872,…
A: Given information- We have given the sticker prices (in dollars) of 11 vehicles at a car dealership.…
Q: Is it possible that creating a Boxplot could show outliers but z-scores show no outlier? Explain…
A: In order to find the outliers, box plot helps to find it is more easier way.
Q: (b) Which companies are outliers according to the 1.5 x IQR rule? Calculate the IQR, and 1.5 × IQR.…
A: Data is given about the revenues of different companies. Given data is:
Q: Can the X-bar chart be used in order to see if the number of defectivesin a production timeslot is…
A: There are two types of Control charts: 1) Control charts for variables. 2) Control charts for…
Q: What are outliers
A:
Q: To earn full credit for this question, use your own sheet of paper to solve the problem, showing all…
A:
Q: The five number summary of a dataset was found to be: 0, 7, 14, 16, 20 An observation is considered…
A: Given data is already arranged in ascending order.0, 7, 14, 16, 20sample size(n)=5
Q: What is an outlier?
A: We have to describe the outlier. Outlier can be present in any dataset.
Q: The National Education Association collects data on the number of years of teaching experience of…
A: Introduction: It is required to identify the outliers, if any.
Q: Construct a box plot from the given data. Diameters of Cans in an Assembly Line: 19. 5.6, 5.5, 5.2,…
A: Boxplot: The box plot is a graphical representation of the data that measurement on interval scale.…
Q: Suppose 50% of all voters in a population support a politican, SHARE What is the zscore of sample…
A:
Q: is an outlier?
A: a) Outlier: The Observation which lies outside the control limit is called an outlier. an outlier is…
Q: Find the median, Q1, Q3, interquartile range (IQR), and list any outliers. 1. 72, 32, 74, 66, 71,…
A:
Q: Check the following data set for outliers. If there is more than one answer, separate them with…
A: The first task is to calculate the median and the quartiles. And in order to compute the median and…
Q: Describe the sampling distribution for the sample means
A: Given, n=100 μ=55 σ=20
Q: he five-number summary of SAT math scores was 200, 440, 510, 600, and 800. Using the 1.5 x1QR rule,…
A:
Q: The five number summary of a dataset was found to be: 45, 53, 58, 67, 70 An observation is…
A:
Q: Are there outliers? And I don't know what the most appropriate box is about
A: Outliers : Some observations within a set of data may fall outside the general scope of the other…
Q: Check the following data set for outliers. If there is more than one answer, separate them with…
A: The box plot based on the given information is:
Q: A researcher plans to conduct a survey. If the population on High City is 1,000,000 find the sample…
A: To calculate the sample size (n) given the population size (N) and a margin of error (e), we use…
Q: The sample proportion Is defined as Multiple Choice x/n n!
A:
Q: A Frequency table of grades has five classes (A, B, C, D, F) with frequencies of 4, 15, 16, 4 and 1…
A: It is an important part of statistics. It is widely used.
Q: Find the median, Q1, Q3, interquartile range (IQR), and list any outliers. 1. 72, 32, 74, 66, 71,…
A: As per our guidelines we can solve first question and rest can be reposted. Q.1 Solution-: Given…
Q: The five number summary of a dataset was found to be: 1, 6, 12, 15, 20 An observation is considered…
A: It is given that The five number summary of datasets Minimum value = 1 First quartile, Q1 = 6…
Q: ht choose to report the interquartile range rather than the exclusive range because: Group of answer…
A: Given: SPSS output
Q: Find the outliers in the following data : 280-500-300-450-330-370-400
A: data set : 280-500-300-450-330-370-400 Fisrtly arrange the data in ascending order Then find first…
Q: The five number summary of a dataset was found to be: 0, 3, 14, 16, 20 An observation is considered…
A: Given - Given the data set to find outlier n=5
Q: Use the IQR to determine if any of the data in the data set are outliers.…
A: Arrange the given data in ascending order0,20,20,23,23,23,23,28,43,80sample size(n)=10
Q: Find out if illiteracy and criminality are associated or independent by using the Proportion Method.
A: The given data can be described as Criminal Not criminal Total Literates 8 (AB) 707 (Aβ) 715…
Q: this is one question. the table has already been answered. are there any potential outliers?
A: Yes. There is one potential outlier.
Q: The highway mileage (mpg) for a sample of 8 different models of a car company can be found below.…
A: Given data is18,21,24,26,36,29,33,36Arrange the data in ascending order18,21,24,26,29,33,36,36sample…
Q: The 5-number summary of scores on a test is 142 148 183 Based on this information, 95 125 There are…
A: Given,minimum value=95Q1=125Q2=142Q3=148maximum value=183
Q: The five number summary of a dataset was found to be: 46, 48, 54, 61, 70 An observation is…
A: The five-number summary is minimum, first quartile, median, third quartile, and maximum.
Q: The five number summary of a dataset was found to be: 0, 2, 12, 15, 20 An observation is considered…
A:
Q: Determine the value of the upper fence
A: Here we have given 5 number summary 17, 25, 27.5, 33, 47 i.e. Minimum = 17 Q1 = 25 Q2 = 27.5 Q3 =…
Trending now
This is a popular solution!
Step by step
Solved in 2 steps with 1 images