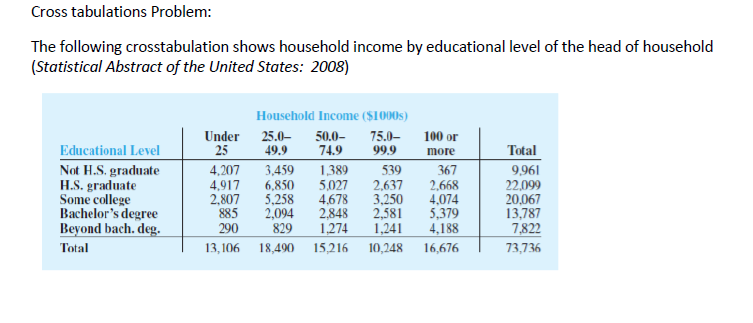
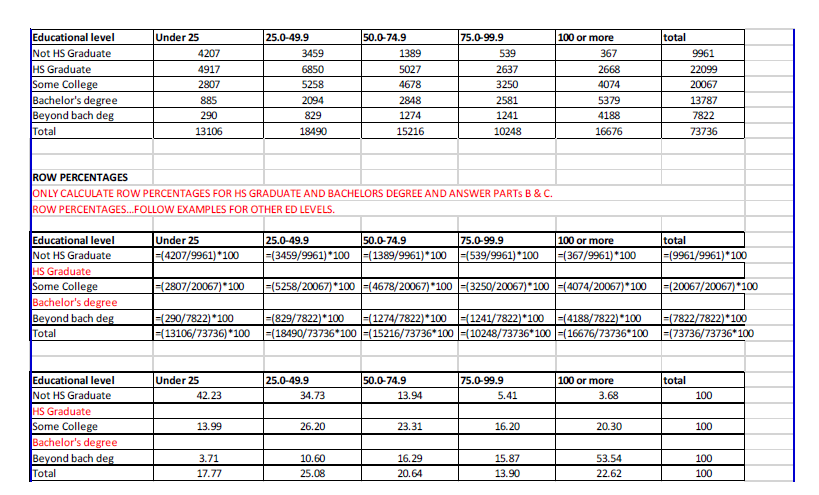
Cross tabulations Problem: The following crosstabulation shows household income by educational level of the head of household (Statistical Abstract of the United States: 2008) Household Income ($1000s) 75.0- 99.9 Under 25.0- 25 49.9 50.0- 74.9 100 or Educational Level Not H.S. graduate H.S. graduate Some college Bachelor's degree Beyond bach. deg. Total 9,961 22,099 20,067 13,787 more 4,207 4,917 2,807 885 3,459 6,850 5,258 2,094 829 1,389 5,027 4,678 2,848 1,274 539 2,637 3,250 2,581 367 2,668 4,074 5,379 4,188 290 1,241 7,822 Total 13, 106 18,490 15,216 10,248 16,676 73,736 Educational level Not HS Graduate HS Graduate Some College Bachelor's degree Beyond bach deg Total Under 25 75.0-99.9 25.0-49.9 50.0-74.9 100 or more total 9961 4207 3459 1389 539 367 4917 6850 5027 2637 2668 22099 3250 2807 5258 4678 4074 20067 885 2094 2848 2581 5379 13787 290 829 1274 1241 4188 7822 13106 18490 15216 10248 16676 73736 ROW PERCENTAGES ONLY CALCULATE ROW PERCENTAGES FOR HS GRADUATE AND BACHELORS DEGREE AND ANSWER PARTS B & C. ROW PERCENTAGES.FOLLOW EXAMPLES FOR OTHER ED LEVELS. Educational level 25.0-49.9 50.0-74.9 75.0-99.9 total Under 25 100 or more =(4207/9961)*100 |3(3459/9961)*100 (1389/9961)*100 (539/9961)*100 =(367/9961)*100 =(9961/9961)*100 Not HS Graduate HS Graduate Some College Bachelor's degree Beyond bach deg Total |=(5258/20067)*100 -(4678/20067)*100 -(3250/20067)*100 -(4074/20067)*100 -(2807/20067)*100 |=(20067/20067)*100 (290/7822)*100 -(13106/73736) *100 I3(1274/7822)*100 =(1241/7822)*100 =(4188/7822)*100 %3D(829/7822)*100 =(18490/73736*100 -(15216/73736*100 =(10248/73736*100 -(16676/73736*100 %3(7822/7822)*100 =(73736/73736*100 Educational level Not HS Graduate HS Graduate Some College Bachelor's degree Beyond bach deg Total 50.0-74.9 Under 25 75.0-99.9 25.0-49.9 100 or more total 42.23 34.73 13.94 5.41 3.68 100 13.99 26.20 23.31 16.20 20.30 100 3.71 10.60 16.29 15.87 53.54 100 17.77 25.08 20.64 13.90 22.62 100


Compound Probability
Compound probability can be defined as the probability of the two events which are independent. It can be defined as the multiplication of the probability of two events that are not dependent.
Tree diagram
Probability theory is a branch of mathematics that deals with the subject of probability. Although there are many different concepts of probability, probability theory expresses the definition mathematically through a series of axioms. Usually, these axioms express probability in terms of a probability space, which assigns a measure with values ranging from 0 to 1 to a set of outcomes known as the sample space. An event is a subset of these outcomes that is described.
Conditional Probability
By definition, the term probability is expressed as a part of mathematics where the chance of an event that may either occur or not is evaluated and expressed in numerical terms. The range of the value within which probability can be expressed is between 0 and 1. The higher the chance of an event occurring, the closer is its value to be 1. If the probability of an event is 1, it means that the event will happen under all considered circumstances. Similarly, if the probability is exactly 0, then no matter the situation, the event will never occur.
Compute the row percentages for high school graduate and bachelor’s degree


Trending now
This is a popular solution!

Step by step
Solved in 5 steps with 3 images


