Cullumber Medical manufactures hospital beds and other institutional furniture. The company's comparative balan income statement for 2019 and 2020 follow. Cullumber Medical Comparative Balance Sheet As of December 31 Assets Current assets Cash Accounts receivable, net Inventory Other current assets Total current assets Property, plant, & equipment, net Total assets Sales revenue (all on account) Cost of goods cold 2020 $397,000 1,089,000 733,000 381,400 Liabilities and Stockholders' Equity Current liabilities $3,156,000 Long-term debt 3,702,600 Total liabilities 6,858,600 Preferred stock, $5 par value 58,950 Common stock, $0.25 par value 104,650 Retained earnings 4,194,495 Total stockholders' equity 4,358,095 Total liabilities and stockholders' equity $11,216,695 2,600,400 2,122,000 8,616,295 8,439,830 $11,216,695 $10,561,830 2020 Cullumber Medical Comparative Income Statement and Statement of Retained Earnings For the Year 2019 $10,177,300 $417,450 776,400 681,050 247,100 5.612.200 $2,846,050 3,892,600 6,738,650 58,950 103,850 3,660,380 3,823,180 $10,561,830 2019 $9,613,950 5 709 700
Cullumber Medical manufactures hospital beds and other institutional furniture. The company's comparative balan income statement for 2019 and 2020 follow. Cullumber Medical Comparative Balance Sheet As of December 31 Assets Current assets Cash Accounts receivable, net Inventory Other current assets Total current assets Property, plant, & equipment, net Total assets Sales revenue (all on account) Cost of goods cold 2020 $397,000 1,089,000 733,000 381,400 Liabilities and Stockholders' Equity Current liabilities $3,156,000 Long-term debt 3,702,600 Total liabilities 6,858,600 Preferred stock, $5 par value 58,950 Common stock, $0.25 par value 104,650 Retained earnings 4,194,495 Total stockholders' equity 4,358,095 Total liabilities and stockholders' equity $11,216,695 2,600,400 2,122,000 8,616,295 8,439,830 $11,216,695 $10,561,830 2020 Cullumber Medical Comparative Income Statement and Statement of Retained Earnings For the Year 2019 $10,177,300 $417,450 776,400 681,050 247,100 5.612.200 $2,846,050 3,892,600 6,738,650 58,950 103,850 3,660,380 3,823,180 $10,561,830 2019 $9,613,950 5 709 700

Intermediate Accounting: Reporting And Analysis
3rd Edition
ISBN:9781337788281
Author:James M. Wahlen, Jefferson P. Jones, Donald Pagach
Publisher:James M. Wahlen, Jefferson P. Jones, Donald Pagach
Chapter4: The Balance Sheet And The Statement Of Shareholders' Equity
Section: Chapter Questions
Problem 4P

Related questions

Question
Transcribed Image Text:Current Attempt in Progress
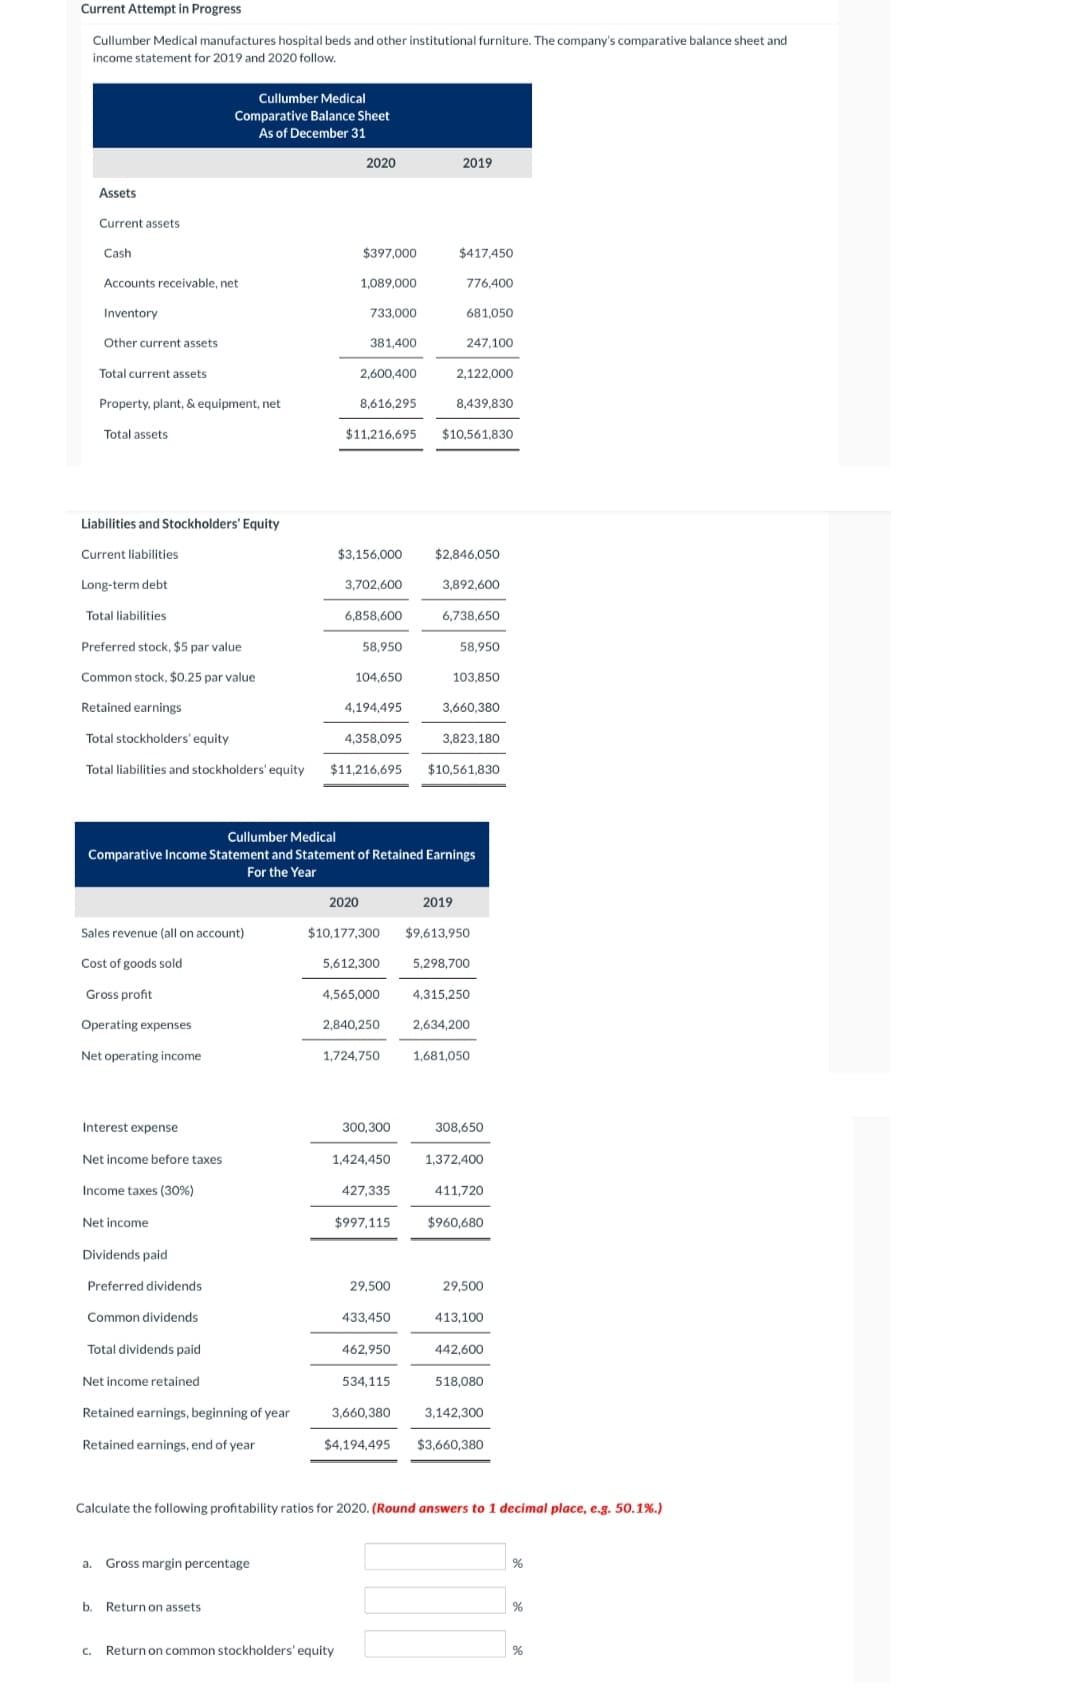
Cullumber Medical manufactures hospital beds and other institutional furniture. The company's comparative balance sheet and
income statement for 2019 and 2020 follow.
Assets
Current assets
Cash
Accounts receivable, net
Inventory
Other current assets
Total current assets
Property, plant, & equipment, net
Total assets
Liabilities and Stockholders' Equity
Current liabilities
Long-term debt
Total liabilities
Sales revenue (all on account)
Cost of goods sold
Gross profit
Operating expenses
Net operating income
Cullumber Medical
Comparative Balance Sheet
As of December 31
Interest expense
Net income before taxes
Income taxes (30%)
Net income
Dividends paid
Preferred dividends
Common dividends
Total dividends paid.
Net income retained
Retained earnings, beginning of year
Retained earnings, end of year
a. Gross margin percentage
b. Return on assets
2020
$397,000
1,089,000
733,000
381,400
2,600,400
8,616,295
Preferred stock, $5 par value
Common stock, $0.25 par value
Retained earnings
Total stockholders' equity
Total liabilities and stockholders' equity $11,216,695 $10,561,830
2020
$3,156,000
3,702,600
6,858,600
C. Return on common stockholders' equity
8,439,830
$11,216,695 $10.561.830
58,950
104,650
4,194,495
4.358,095
Cullumber Medical
Comparative Income Statement and Statement of Retained Earnings
For the Year
$10,177,300
5,612,300
300,300
1,424,450
427,335
$997,115
2019
$417,450
776,400
433,450
462,950
681,050
534,115
247,100
2,122,000
$2,846,050
3,892,600
6,738,650
2019
58,950
103,850
4,565,000 4.315,250
2,840,250
2,634,200
1,724,750 1,681,050
3,660,380
3,823,180
$9,613,950
5,298,700
308,650
1,372,400
411,720
$960,680
29,500
413,100
442,600
Calculate the following profitability ratios for 2020. (Round answers to 1 decimal place, e.g. 50.1%.)
518,080
3,660,380 3,142,300
$4,194,495 $3,660,380
%
%
%
Expert Solution
This question has been solved!
Explore an expertly crafted, step-by-step solution for a thorough understanding of key concepts.

This is a popular solution!

Trending now
This is a popular solution!

Step by step
Solved in 4 steps

Knowledge Booster


Learn more about
Need a deep-dive on the concept behind this application? Look no further. Learn more about this topic, accounting and related others by exploring similar questions and additional content below.Recommended textbooks for you
Intermediate Accounting: Reporting And Analysis
Accounting
ISBN:
9781337788281
Author:
James M. Wahlen, Jefferson P. Jones, Donald Pagach
Publisher:
Cengage Learning

Cornerstones of Financial Accounting
Accounting
ISBN:
9781337690881
Author:
Jay Rich, Jeff Jones
Publisher:
Cengage Learning
Intermediate Accounting: Reporting And Analysis
Accounting
ISBN:
9781337788281
Author:
James M. Wahlen, Jefferson P. Jones, Donald Pagach
Publisher:
Cengage Learning
Cornerstones of Financial Accounting
Accounting
ISBN:
9781337690881
Author:
Jay Rich, Jeff Jones
Publisher:
Cengage Learning