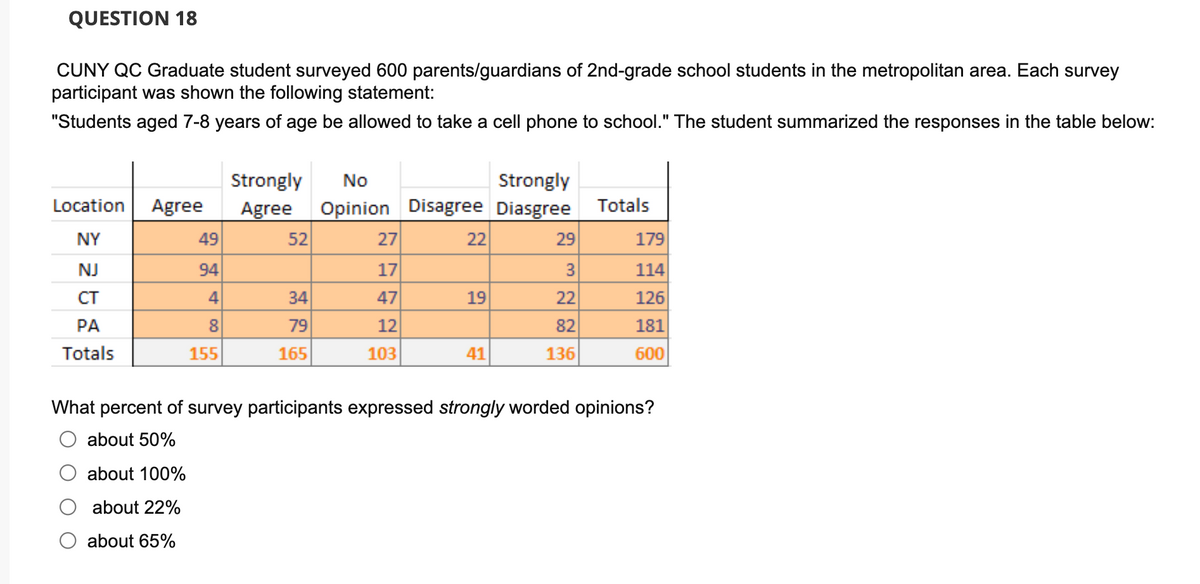
CUNY QC Graduate student surveyed 600 parents/guardians of 2nd-grade school students in the metropolitan area. Each survey participant was shown the following statement: "Students aged 7-8 years of age be allowed to take a cell phone to school." The student summarized the responses in the table below: Strongly Agree 49 Strongly Opinion Disagree Diasgree No Location Agree Totals NY 52 27 22 29 179 NJ 94 17 3 114 CT 4 34 47 19 22 126 PA 8. 79 12 82 181 Totals 155 165 103 41 136 600


Q: A letter is chosen at random from the word 'ASSASSINATION'. Find the probability that letter is (i)…
A:
Q: A data set includes the counts of chocolate chips from three different types of Chips Ahoy cookies.…
A:
Q: A data set includes data from student evaluations of courses. The summary statistics are n = 89. *=…
A:
Q: Reading proficiency: An educator wants to construct a 98% confidence interval for the proportion…
A: The confidence level is 98% Therefore, α = 0.02 and α/2=0.01. The margin of error is 0.03. Since the…
Q: Answer makes no sense, handwritting hard to read , please answer in the format of the question
A: Given the statements related to standard error and confidence interval for mean. We have to solve…
Q: 3.1. Use the Neyman-Person lemma to find the best critical region of size 0.034 for testing Ho:0 = 1…
A:
Q: 5. Let f(x) is probability distribution function of X with: f(x) = { 21, x = 0, 1, 2, 3, 4, х 3 0,…
A:
Q: Use normal approximation to estimate the probability of getting less than 52 girls in 100 births.…
A:
Q: Question 1 What is the variable type for the type of flooring in a room? O Qualitative Discrete O…
A: Quantitative variable are numeric on nature and divided into two categories discrete and continuous.
Q: We have a population of frogs with a mean weight of 0.9 pounds. We select four frogs and find their…
A:
Q: 2.88 Characteristics of a rockfall. Refer to the Environmental O Geology (Vol. 58, 2009) study of…
A: For the given data Find Range = ? Variance = ? Standard deviation = ?
Q: The average life of a bread making machine is 7 years, with a standard deviation of 1 year. Assuming…
A:
Q: Use the value of the linear correlation coefficient r to find the coefficient of determination and…
A:
Q: 1.5 If Y, and Y2 are independent random variables, it must be_
A: Solution
Q: elsewhere. 2.1.1. Find the MLE Ô of 8. 2.1.2. Find the expected value, varlance of ôð and then the…
A:
Q: 2. A company which produces batteries claims that the life expectancy of their batteries is 90…
A:
Q: A clothing store wants to investigate customer preferences between four different types of clothes…
A: Anova is used to measure the mean significance between more than three groups. It follows the…
Q: A manufacturer produces piston rings for an automobile engine. It is known that ring diameter is…
A: Given: n = 35 σ = 0.001 x¯ = 74.036
Q: Table 10-2 A problem with a phone line that prevents a customer from receiving or making calls…
A: The given information is, Central Office I Time to Clear Problems (minutes) 1.48 1.75 0.78 2.85 0.52…
Q: The total rejection region for a two-tailed test for a mean, that has a test statistic, of 2.16 has…
A:
Q: In rolling a fair die once, what is the probability of rolling a 2 or an odd number? show solution
A:
Q: Two kinds of thread are being compared for strength. Fifty pieces of each type of thread are tested…
A:
Q: 2.2 Solve the below problem: Use the uniqueness of moment-generating functions to give the…
A: Solution
Q: In a manufacturing company, a new production process is being considered to replace the old process…
A: According to Policy we can answer only first three question for remaining please repost the…
Q: A jar contains 6 red marbles, numbered 1 to 6, and 12 blue marbles numbered 1 to 12. Find the…
A:
Q: O Best one is x2 = Climb O Best one is x1 = Distance
A: Required knowledge: The model with high R-sq(adj) would be the best model.
Q: Random samples of size 4 are drawn, with replacement, from the finite population 2, 4, and 6. Find…
A:
Q: HWM-10(3) Please help me with the below question needed with a clear step by step explanation,…
A:
Q: Random samples of size 4 are drawn, with replacement, from the finite population 2, 4, and 6. FindH_…
A:
Q: A tea store manager claims that Branch A has lower average daily sales compared to Branch B. He…
A: According to our policy we can answer only first three question for remaining please repost the…
Q: Assume the results of a an empirical study reveal the following: n= 250, sample mean = 140, sample…
A:
Q: Example 26. In how many ways can 7 gentlemen and 7 ladies be seated at a round table so that no 2…
A:
Q: Some states now allow online gambling. As a marketing manager for a casino, you need to determine…
A:
Q: On the proposal of the OCTA Research that 90 percent of the vaccines should be for| Metro Manila ++…
A: Ghhddggg
Q: a. Null and alternative hypothesis b. Level of significance c. Test statistics to be used and decide…
A: The provided information is n1=40, n2=40x¯1=15500, x¯2=17510s1=53, s2=35α=0.01 a. The null and…
Q: Systolic Blood Pressure (SBP) of 13 workers follows normal distribution with standard deviation 10.…
A: We have given that, The data set are :- 129, 134, 142, 114, 120, 116, 133, 142, 138, 148, 129, 133,…
Q: If n=12, ¯xx¯(x-bar)=48, and s=6, find the margin of error at a 98% confidence level
A: From the provided information, Sample size (n) = 12 Sample mean (x̄) = 48 Standard deviation (s) = 6…
Q: 1.1. Show that Y(n) max(Y1, Y2, ..., Yn) is sufficient for 0.
A:
Q: Show your solutions and draw the curves for the word problems. I. Find the area under the normal…
A: According to our policy we can answer only first question, for remaining please repost the question.…
Q: i. Calculate the size of the test, expressing your answer in terms of (i.e. the standard normal…
A:
Q: Two kinds of thread are being compared for strength. Fifty pieces of each type of thread are tested…
A:
Q: 26- The ages of people in a class (to the nearest year) are as follows: Age Number of Students 14…
A: We have given that, Age (X) Number of students (f) 18 14 19 120 20 200 21 200 22 90…
Q: The below time series gives the indices of Industrial Production in U.S for 10 consecutive years.…
A: When we want to predict the value of one variable, say y, from the given value of another variable,…
Q: In a survey, 10 people were asked how much they spent on their child's last birthday gift. The…
A:
Q: is that a p or phat?
A: The null and alternative hypothesis are, Here, p denote the population proportion
Q: challenged 6036 referee calls, with result that 1757 were successfully overturned. Women's single…
A: Given, Favorable Cases for men (X1) = 1757 Sample Size 1 (n1) = 6063 Favorable Cases for women (X2)=…
Q: (8) If a random process X(t) with zero mean has the DC component A as Y(t) = A+X(t), then Ryy (T) =…
A:
Q: Based on this, construct a 90% confidence interval for the true population mean watermelon weight
A: It is given that Sample size n = 20 Sample mean M = 51 Population SD = 4.3 The critical value of Z…
Q: An analyst calculated the correlation coefficient between the unemployment rate in the United States…
A: Strength of Correlation coefficient is If r<0.5 weak correlation If r>0.5 strong correlation…
Q: Mean - 7.6 Std. Dev. 2.07 N= 317 60- 20 Frequency
A:


Trending now
This is a popular solution!

Step by step
Solved in 2 steps

- Question No. 4: According to the All Pakistan Software Developer Association (APSDA), developers generally spend more than 40 hours each week working on software and web development. The Table 4.1 shows the number of hours worked per week for a sample of 15 Software developers and a sample of 10 Web developers. Table 4.1 Software Developers 56 54 54 49 61 48 58 60 59 53 50 58 55 57 52 Web Developers 47 50 46 47 48 49 46 55 44 42 ---- a) What is the third quartile of spending working hours for Software developers? b) Create a box plot for the number of hours worked for Software developers. c) Create a box plot for the number of hours worked for Web developers. d) Comment on the differences between the box plots for Software & Web developers.QUESTION 1 The Ministry of Health and Social Services (MoHSS) in Namibia intends to embark upon a COVID19 vaccination campaign in the Country. But before deciding which type of COVID19 vaccine to be ordered from the Manufacturers, they first carried out a survey on some countries around the world in order to establish the most preferred vaccine. The findings revealed that: Sixty-eight (68) of them prefer the Pfizer; fifty-two (52) prefer the Moderna; and forty-eight (48) prefer the AstraZeneca. Thirty-six (36) of them prefer Pfizer and AstraZeneca; twenty-two (22) of them prefer Moderna and AstraZeneca; None of the countries prefer AstraZeneca only; 24 prefer Moderna only; 26 prefer Pfizer only; and the remaining 90 countries preferred none of the vaccines. REQUIRED: A.)How many preferred Pfizer or AstraZeneca but not Moderna? B.)What is the ratio (in the simplest form) of the countries that preferred Moderna to those that prefer Pfizer and AstraZeneca? C.)How many countries did not…Question 4a. A large accountancy firm finds that over the long run 10% of its statements for clients are in error in some way. A quality assurance officer at the firm investigating the source of the errors takes a sample of 20 statements produced by a single employee and classifies each as being “in error” or “not in error”.i. If the variable X is used to represent the number of statements in the sample that are in error, and assuming the error rate is the firm’s level of 10% then state:• the type of distribution this variable has; and• the parameter/s of this distribution. ii. Determine the probability that 2 or less returns in this sample are in error. The quality assurance officer found that there were 5 statements in the sample that were in error.iii. Determine the probability of finding 5 or more returns in error if indeed the error rate was 10%. iv. Based upon your answer for part iii., what conclusion might the quality assurance office make about this employee in terms of the…
- 9. A research center claims that 24% of adults in a certain country would travel into space on a commercial flight if they could afford it. In a random sample of 700 adults in that country, 28% say that they would travel into space on a commercial flight if they could afford it. At α=0.05, is there enough evidence to reject the research center's claim? Complete parts (a) through (d) below. Question content area bottom Part 1 (a) Identify the claim and state H0 and Ha. Identify the claim in this scenario. Select the correct choice below and fill in the answer box to complete your choice. (Type an integer or a decimal. Do not round.) A. The percentage adults in the country who would travel into space on a commercial flight if they could afford it is not enter your response here %. B. No more than enter your response here % of adults in the country would travel into space on a commercial flight if they could afford it. C. At least…Question #1 chpt 10 hypothesis test and H0 and Ha(Topic 16) The following data is based upon the results from the *Granite State Poll (New Hampshire polling center) made available on October 19th, 2020. The poll asked respondents about how stressed they were on a scale of 1 through 10 (10 being most stressed) regarding certain events in 2020. In April of 2020, a random sample of 1,002 New Hampshire residents were asked how stressed they were about Covid-19 and 57% of them answered 7 or greater. In October of 2020, a random sample of 899 New Hampshire residents were asked how stressed they were about the presidential election and 68% of them answered 7 or greater. Use this information to complete the hypothesis test claiming that the proportion of people who had a stress level of 7 or more regarding the presidential election was greater than those who had a stress level of 7 or more regarding the Covid-19 pandemic back in April at the 1% significance level. (a) What is the null hypothesis (H0), alternate hypothesis (H1), and tail…
- Question 15: In a recent Super Bowl, a TV network predicted that 90 % of the audience would express an interest in seeing one of its forthcoming television shows. The network ran commercials for these shows during the Super Bowl. The day after the Super Bowl, and Advertising Group sampled 55 people who saw the commercials and found that 48 of them said they would watch one of the television shows.Suppose you are have the following null and alternative hypotheses for a test you are running:H0:p=0.9H0:p=0.9Ha:p>0.9Ha:p>0.9Calculate the test statistic, rounded to 3 decimal places z=Question 12. Directors of a company claim that 90% of the workforce supports a new shift pattern that they have suggested. A random survey of 100 people in the workforce finds 85 in favour of the new scheme. Test if there is a significant difference between the survey results and the director's claim. 12.1 What kind of test will you perform? (a) 1 sample z-test (b) 1 sample t-test (c) 1 sample proportion t-test (d) 2 sample t-test 12.2 State the Alternative Hypothesis (a) H1: mu < 0.9 (b) H1: mu > 0.9 (c) H1: mu 0.9 (d) H1: mu 0.9In a 2014 study, Grossi, Larach, Canals, Vásquez, and Iriarte-Diaz connected weighted sticks to the back of 4 domestic chickens to mimic the tail of a dinosaur and recorded the chicken both walking and standing. They concluded that the manner in which these chickens with dinosaur-like tails then walked in a manner consistent with to the theorized manner in which non-avian dinosaurs walked. What is the population of this study? Question 10 options: All chickens All chickens wearing simulated dinosaur tails Non-avian dinosaurs The 4 chickens studied
- Question 2 The past records of a supermarket show that its customers spend an average of $65 per visit at this store. Recently the management of the store initiated a promotional campaign according to which each customer receives points based on the total money spent at the store, and these points can be used to buy products at the store. The management expects that as a result of this campaign, the customers should be encouraged to spend more money at the store. To check whether this is true, the manager of the store took a sample of 12 customers who visited the store. The following data give the money (in dollars) spent by these customers at this supermarket during their visits. 88 69 141 28 106 45 32 51 78 54 110 83 Assume that the money spent by all customers at this supermarket has a normal distribution. Using the 5% significance level, can you conclude that the mean amount of money spend by all customers at this supermarket after the campaign was started is more than $65?QUESTION 7 Using the logical estimate evaluator strategy to reason out the frequency of throwing every possible outcome for 3 dice, which number of rolls have the same outcome frequency? 10 and 11 9 and 11 6 and 8 8 and 9