curve for the test statistic under the assumption that the null hypothesis is true. Use the graph to solve the problem. A graphical display of the decision criterion follows. Reject Ho и 0.01 Reject Ho Do not reject Ho 0.01 O B. Z= -2.33 or z = 2.33 OC. z≤ -2.33 or z≥ 2.33 OD. -2.33 ≤z≤2.33
curve for the test statistic under the assumption that the null hypothesis is true. Use the graph to solve the problem. A graphical display of the decision criterion follows. Reject Ho и 0.01 Reject Ho Do not reject Ho 0.01 O B. Z= -2.33 or z = 2.33 OC. z≤ -2.33 or z≥ 2.33 OD. -2.33 ≤z≤2.33

Glencoe Algebra 1, Student Edition, 9780079039897, 0079039898, 2018
18th Edition
ISBN:9780079039897
Author:Carter
Publisher:Carter
Chapter10: Statistics
Section10.4: Distributions Of Data
Problem 19PFA

Related questions
Question
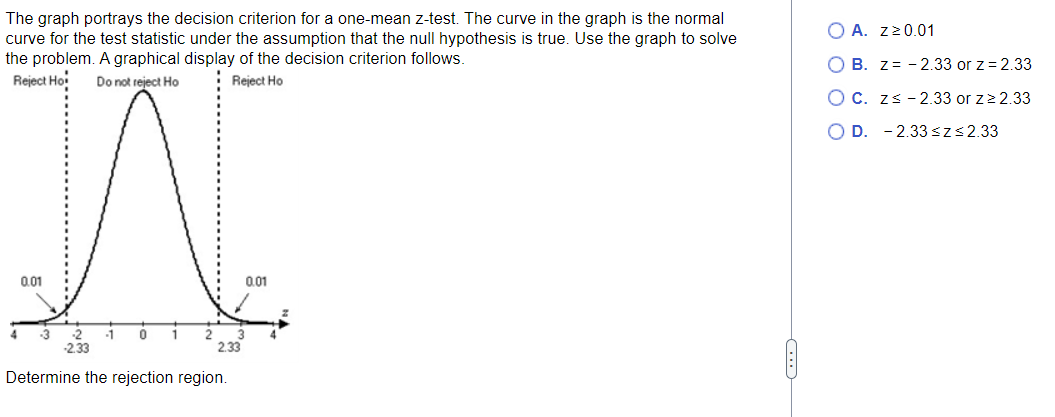
Transcribed Image Text:The graph portrays the decision criterion for a one-mean z-test. The curve in the graph is the normal
curve for the test statistic under the assumption that the null hypothesis is true. Use the graph to solve
the problem. A graphical display of the decision criterion follows.
Reject Ho
Reject Ho Do not reject Ho
N
0.01
0.01
0 1 2
-3 -2 -1
-2.33
2.33
Determine the rejection region.
OA. Z≥ 0.01
B. z -2.33 or z= 2.33
O C. z≤ -2.33 or z ≥ 2.33
O D. - 2.33 ≤z≤ 2.33
Expert Solution
This question has been solved!
Explore an expertly crafted, step-by-step solution for a thorough understanding of key concepts.

Step by step
Solved in 3 steps with 4 images

Recommended textbooks for you
Glencoe Algebra 1, Student Edition, 9780079039897…
Algebra
ISBN:
9780079039897
Author:
Carter
Publisher:
McGraw Hill
Glencoe Algebra 1, Student Edition, 9780079039897…
Algebra
ISBN:
9780079039897
Author:
Carter
Publisher:
McGraw Hill