C)What effect does switching the explanatory and response variables have on the regression line? A.The sign of m is unchanged, but the values of m and b change. B.The value of b is unchanged, but the sign and value of m change. C.The value of m is unchanged, but the sign of m and value of b change. D.The sign and value of m is unchanged, but the value of b changes. E.The sign and value of m and the value of b all change. F.Nothing changes.
C)What effect does switching the explanatory and response variables have on the regression line? A.The sign of m is unchanged, but the values of m and b change. B.The value of b is unchanged, but the sign and value of m change. C.The value of m is unchanged, but the sign of m and value of b change. D.The sign and value of m is unchanged, but the value of b changes. E.The sign and value of m and the value of b all change. F.Nothing changes.

Algebra & Trigonometry with Analytic Geometry
13th Edition
ISBN:9781133382119
Author:Swokowski
Publisher:Swokowski
Chapter7: Analytic Trigonometry
Section7.6: The Inverse Trigonometric Functions
Problem 94E

Related questions
Topic Video
Question
(only question C)What effect does switching the explanatory and response variables have on the regression line?
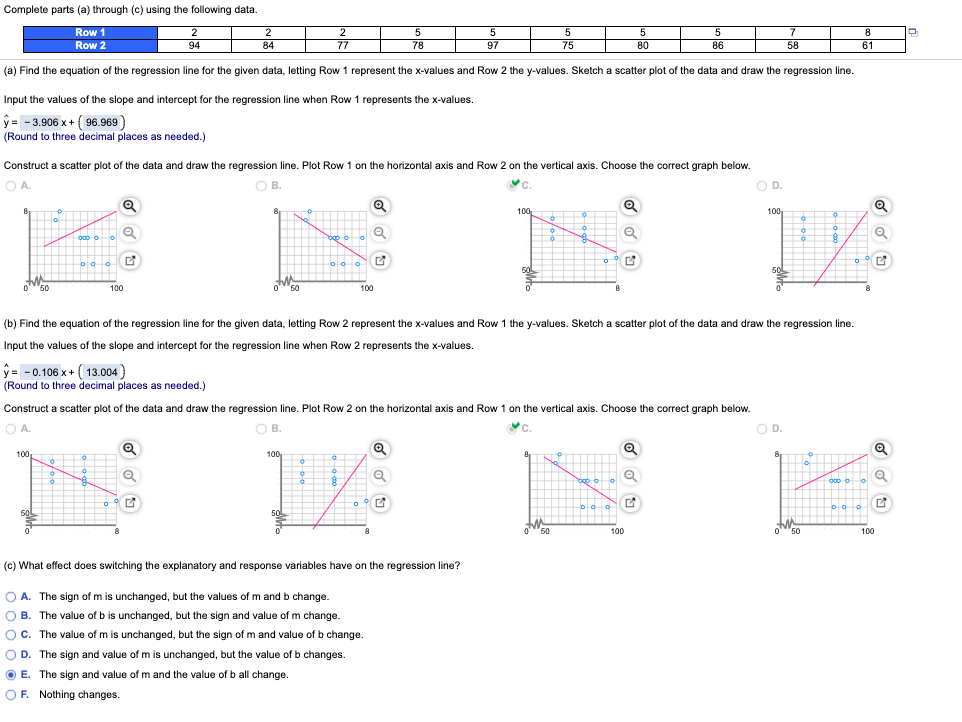
Transcribed Image Text:Complete parts (a) through (c) using the following data.
Row 1
2
2
2
8
Row 2
94
84
77
78
97
75
80
86
58
61
(a) Find the equation of the regression line for the given data, letting Row 1 represent the x-values and Row 2 the y-values. Sketch a scatter plot of the data and draw the regression line.
Input the values of the slope and intercept for the regression line when Row 1 represents the x-values.
V = - 3.906 x + ( 96.969)
(Round to three decimal places as needed.)
Construct a scatter plot of the data and draw the regression line. Plot Row 1 on the horizontal axis and Row 2 on the vertical axis. Choose the correct graph below.
OA.
O B.
OD.
Q
100
100
ooo
50
050
100
100
(b) Find the equation of the regression line for the given data, letting Row 2 represent the x-values and Row 1 the y-values. Sketch a scatter plot of the data and draw the regression line.
Input the values of the slope and intercept for the regression line when Row 2 represents the x-values.
ý = - 0.106 x + ( 13.004)
(Round to three decimal places as needed.)
Construct a scatter plot of the data and draw the regression line. Plot Row 2 on the horizontal axis and Row 1 on the vertical axis. Choose the correct graph below.
OB.
O
D.
Q
100
100
50
50
100
o50
100
(c) What effect does switching the explanatory and response variables have on the regression line?
O A. The sign of m is unchanged, but the values of m and b change.
O B. The value of b is unchanged, but the sign and value of m change.
c. The value of m is unchanged, but the sign of m and value of b change.
D. The sign and value of m is unchanged, but the value of b changes.
E. The sign and value of m and the value of b all change.
OF. Nothing changes.
Expert Solution
This question has been solved!
Explore an expertly crafted, step-by-step solution for a thorough understanding of key concepts.

This is a popular solution!

Trending now
This is a popular solution!

Step by step
Solved in 2 steps

Knowledge Booster


Learn more about
Need a deep-dive on the concept behind this application? Look no further. Learn more about this topic, statistics and related others by exploring similar questions and additional content below.Recommended textbooks for you
Algebra & Trigonometry with Analytic Geometry
Algebra
ISBN:
9781133382119
Author:
Swokowski
Publisher:
Cengage

Functions and Change: A Modeling Approach to Coll…
Algebra
ISBN:
9781337111348
Author:
Bruce Crauder, Benny Evans, Alan Noell
Publisher:
Cengage Learning
Algebra & Trigonometry with Analytic Geometry
Algebra
ISBN:
9781133382119
Author:
Swokowski
Publisher:
Cengage
Functions and Change: A Modeling Approach to Coll…
Algebra
ISBN:
9781337111348
Author:
Bruce Crauder, Benny Evans, Alan Noell
Publisher:
Cengage Learning