D 1 The region D above lies between the graphs of y = 2 – (x – 4) and y = 2 + 7 (x – 2)°. It can be described in two ways. 1. If we visualize the region having "top" and "bottom" boundaries, express each as functions of x and provide the interval of x-values that covers the entire region. "top" boundary 92(x) = | 2 – - (x – 4)² "bottom" boundary g1(x) = | -2+ (x – 2)3 interval of x values that covers the region =
D 1 The region D above lies between the graphs of y = 2 – (x – 4) and y = 2 + 7 (x – 2)°. It can be described in two ways. 1. If we visualize the region having "top" and "bottom" boundaries, express each as functions of x and provide the interval of x-values that covers the entire region. "top" boundary 92(x) = | 2 – - (x – 4)² "bottom" boundary g1(x) = | -2+ (x – 2)3 interval of x values that covers the region =

Functions and Change: A Modeling Approach to College Algebra (MindTap Course List)
6th Edition
ISBN:9781337111348
Author:Bruce Crauder, Benny Evans, Alan Noell
Publisher:Bruce Crauder, Benny Evans, Alan Noell
Chapter1: Functions
Section1.2: Functions Given By Tables
Problem 32SBE: Does a Limiting Value Occur? A rocket ship is flying away from Earth at a constant velocity, and it...

Related questions
Question
Transcribed Image Text:D
1
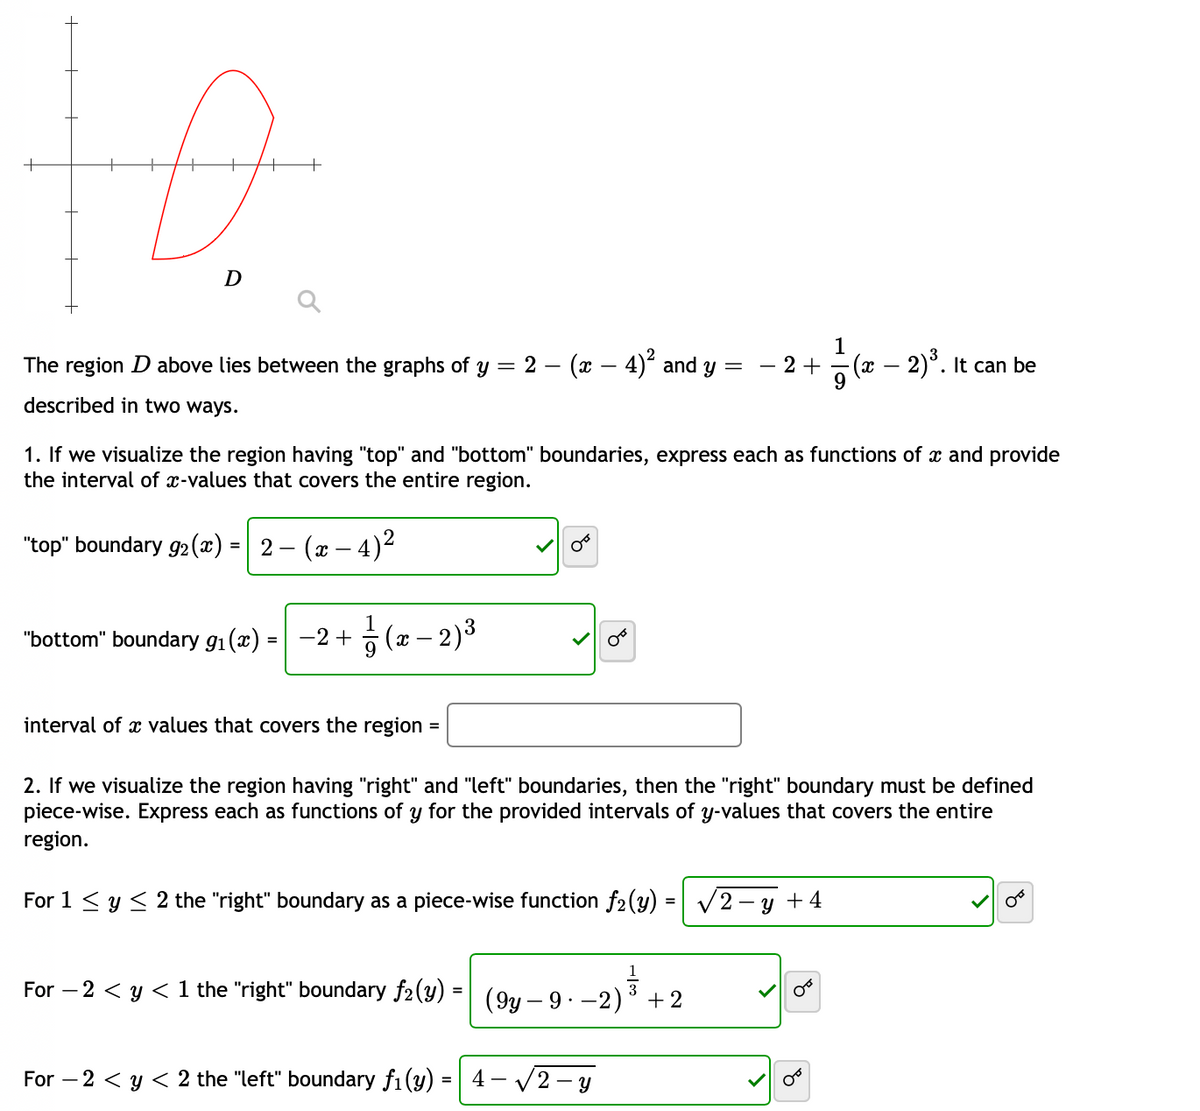
The region D above lies between the graphs of y =
2 - (x – 4)° and y
2 + - (x – 2)°. It can be
described
two ways.
1. If we visualize the region having "top" and "bottom" boundaries, express each as functions of x and provide
the interval of x-values that covers the entire region.
"top" boundary g2 (æ) = | 2 – (x – 4)2
%3D
"bottom" boundary g1(x) =
ㅎ (2-2)3
-2 +
%3D
interval of x values that covers the region
2. If we visualize the region having "right" and "left" boundaries, then the "right" boundary must be defined
piece-wise. Express each as functions of y for the provided intervals of y-values that covers the entire
region.
For 1 < y < 2 the "right" boundary as a piece-wise function f2(y) = V2 - y +4
For – 2 < y < 1 the "right" boundary f2(y) = (9y – 9. -2)
+ 2
For – 2 < y < 2 the "left" boundary f1(y) = | 4– V2 – y
-
Expert Solution
This question has been solved!
Explore an expertly crafted, step-by-step solution for a thorough understanding of key concepts.

Step by step
Solved in 2 steps with 1 images

Recommended textbooks for you
Functions and Change: A Modeling Approach to Coll…
Algebra
ISBN:
9781337111348
Author:
Bruce Crauder, Benny Evans, Alan Noell
Publisher:
Cengage Learning

College Algebra
Algebra
ISBN:
9781305115545
Author:
James Stewart, Lothar Redlin, Saleem Watson
Publisher:
Cengage Learning

Algebra & Trigonometry with Analytic Geometry
Algebra
ISBN:
9781133382119
Author:
Swokowski
Publisher:
Cengage
Functions and Change: A Modeling Approach to Coll…
Algebra
ISBN:
9781337111348
Author:
Bruce Crauder, Benny Evans, Alan Noell
Publisher:
Cengage Learning
College Algebra
Algebra
ISBN:
9781305115545
Author:
James Stewart, Lothar Redlin, Saleem Watson
Publisher:
Cengage Learning
Algebra & Trigonometry with Analytic Geometry
Algebra
ISBN:
9781133382119
Author:
Swokowski
Publisher:
Cengage