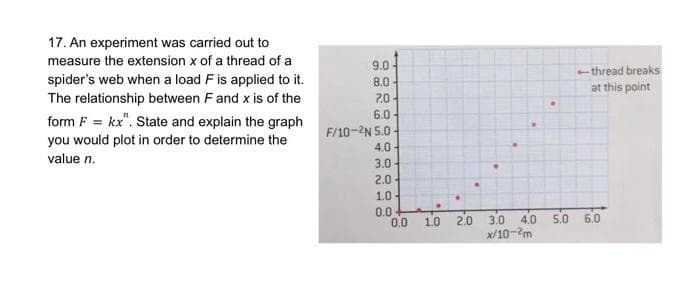
17. An experiment was carried out to measure the extension x of a thread of a 9.0 spider's web when a load F is applied to it. The relationship between Fand x is of the - thread breaks at this point 8.0 2.0 6.0 F/10-2N 5.0 - form F = kx". State and explain the graph you would plot in order to determine the value n. 4.0 3.0 2.0 1.0 0.0 0.0 5.0 6.0 1.0 2.0 3.0 4.0 x/10-2m
17. An experiment was carried out to measure the extension x of a thread of a 9.0 spider's web when a load F is applied to it. The relationship between Fand x is of the - thread breaks at this point 8.0 2.0 6.0 F/10-2N 5.0 - form F = kx". State and explain the graph you would plot in order to determine the value n. 4.0 3.0 2.0 1.0 0.0 0.0 5.0 6.0 1.0 2.0 3.0 4.0 x/10-2m

Algebra & Trigonometry with Analytic Geometry
13th Edition
ISBN:9781133382119
Author:Swokowski
Publisher:Swokowski
Chapter7: Analytic Trigonometry
Section7.6: The Inverse Trigonometric Functions
Problem 91E

Related questions

Concept explainers
Transformation of Graphs
The word ‘transformation’ means modification. Transformation of the graph of a function is a process by which we modify or change the original graph and make a new graph.
Exponential Functions
The exponential function is a type of mathematical function which is used in real-world contexts. It helps to find out the exponential decay model or exponential growth model, in mathematical models. In this topic, we will understand descriptive rules, concepts, structures, graphs, interpreter series, work formulas, and examples of functions involving exponents.
Question
Transcribed Image Text:17. An experiment was carried out to
measure the extension x of a thread of a
9.0
- thread breaks
spider's web when a load F is applied to it.
The relationship between Fand x is of the
8.0
at this point
2.0
6.0
form F = kx". State and explain the graph
F/10-2N 5.0
you would plot in order to determine the
4.0
value n.
3.0
2.0
1.0
0.0
0.0
2.0
5.0
6.0
4.0
x/10-2m
1.0
3.0
O OO 000 000
Expert Solution
This question has been solved!
Explore an expertly crafted, step-by-step solution for a thorough understanding of key concepts.

This is a popular solution!

Trending now
This is a popular solution!

Step by step
Solved in 2 steps with 2 images

Knowledge Booster


Learn more about
Need a deep-dive on the concept behind this application? Look no further. Learn more about this topic, algebra and related others by exploring similar questions and additional content below.Recommended textbooks for you
Algebra & Trigonometry with Analytic Geometry
Algebra
ISBN:
9781133382119
Author:
Swokowski
Publisher:
Cengage
Algebra & Trigonometry with Analytic Geometry
Algebra
ISBN:
9781133382119
Author:
Swokowski
Publisher:
Cengage