(b) Give a point estimate of a. (Round your answer to five decimal places.) Interpret this estimate. s is the typical amount by which the -Select-- regression line. ] value -Select-- ]what is predicted using the least squares (c) Give an estimate of the average change in depression score change associated with a 1 kg/m? increase in BMI change. (Round your answer to three decimal places.)
(b) Give a point estimate of a. (Round your answer to five decimal places.) Interpret this estimate. s is the typical amount by which the -Select-- regression line. ] value -Select-- ]what is predicted using the least squares (c) Give an estimate of the average change in depression score change associated with a 1 kg/m? increase in BMI change. (Round your answer to three decimal places.)

Functions and Change: A Modeling Approach to College Algebra (MindTap Course List)
6th Edition
ISBN:9781337111348
Author:Bruce Crauder, Benny Evans, Alan Noell
Publisher:Bruce Crauder, Benny Evans, Alan Noell
Chapter5: A Survey Of Other Common Functions
Section5.3: Modeling Data With Power Functions
Problem 3TU

Related questions
Question
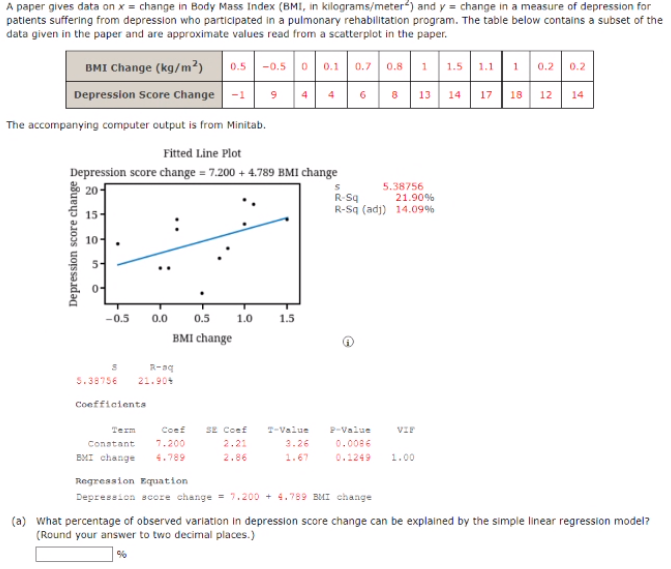
Transcribed Image Text:A paper gives data on x = change in Body Mass Index (BMI, in kilograms/meter) and y = change in a measure of depression for
patients suffering from depression who participated in a pulmonary rehabilitation program. The table below contains a subset of the
data given in the paper and are approximate values read from a scatterplot in the paper.
BMI Change (kg/m²)
1 1.5
1.1| 1 0.2 0.2
0.5 -0.5 0 0.1 0.7 0.8
Depression Score Change -1
4
4.
6
13
14
17
18
12
14
The accompanying computer output is from Minitab.
Fitted Line Plot
Depression score change = 7.200 + 4.789 BMI change
e =7.
20
5.38756
21.90%
R-Sq
R-Sq (adj) 14.09%
15-
10
-0.5
0.0
0.5
1.0
1.5
BMI change
R-aq
5.38756
21.904
Coefficienta
Term
Coef
Sz Coef
7-Value
P-Value
Vir
Constant
7.200
2.21
3.26
0.0086
BMI change
4.789
2.86
1.67
0.1249
1.00
Regression Equation
Depression score change = 7.200 + 4.789 BMI change
(a) What percentage of observed variation in depression score change can be explained by the simple linear regression model?
(Round your answer to two decimal places.)
Depression score change
![(b) Give a point estimate of o. (Round your answer to five decimal places.)
Interpret this estimate.
s is the typical amount by which the -Select--
value -Select-
]what is predicted using the least squares
regression line.
(c) Give an estimate of the average change in depression score change associated with a 1 kg/m? increase in BMI change. (Round
your answer to three decimal places.)
(d) Calculate a point estimate of the mean depression score change for a patient whose BMI change was 1.2 kg/m². (Round your
answer to three decimal places.)](/v2/_next/image?url=https%3A%2F%2Fcontent.bartleby.com%2Fqna-images%2Fquestion%2F4ad05b3f-cede-4ed2-b491-50ea33a79807%2Ffbbdc77d-2236-44e2-9f8d-5a54ffb31731%2F1thbj1d_processed.png&w=3840&q=75)
Transcribed Image Text:(b) Give a point estimate of o. (Round your answer to five decimal places.)
Interpret this estimate.
s is the typical amount by which the -Select--
value -Select-
]what is predicted using the least squares
regression line.
(c) Give an estimate of the average change in depression score change associated with a 1 kg/m? increase in BMI change. (Round
your answer to three decimal places.)
(d) Calculate a point estimate of the mean depression score change for a patient whose BMI change was 1.2 kg/m². (Round your
answer to three decimal places.)
Expert Solution
This question has been solved!
Explore an expertly crafted, step-by-step solution for a thorough understanding of key concepts.

Step by step
Solved in 4 steps

Follow-up Questions
Read through expert solutions to related follow-up questions below.
Follow-up Question

Transcribed Image Text:(d) Calculate a point estimate of the mean depression score change for a patient whose BMI change was 1.2 kg/m2. (Round your
answer to three decimal places.)
Solution
Recommended textbooks for you
Functions and Change: A Modeling Approach to Coll…
Algebra
ISBN:
9781337111348
Author:
Bruce Crauder, Benny Evans, Alan Noell
Publisher:
Cengage Learning


Algebra & Trigonometry with Analytic Geometry
Algebra
ISBN:
9781133382119
Author:
Swokowski
Publisher:
Cengage
Functions and Change: A Modeling Approach to Coll…
Algebra
ISBN:
9781337111348
Author:
Bruce Crauder, Benny Evans, Alan Noell
Publisher:
Cengage Learning
Algebra & Trigonometry with Analytic Geometry
Algebra
ISBN:
9781133382119
Author:
Swokowski
Publisher:
Cengage


Trigonometry (MindTap Course List)
Trigonometry
ISBN:
9781337278461
Author:
Ron Larson
Publisher:
Cengage Learning

College Algebra
Algebra
ISBN:
9781305115545
Author:
James Stewart, Lothar Redlin, Saleem Watson
Publisher:
Cengage Learning