Estimat (Intercept) -17.5791 6.7584 -2.601 0.0123 3.9324 0.4155 9.464 1.49e-12 Multiple R-squared: 0.6511 Analysis of Variance Table Df Sum Sq Mean Sq F value 1 21186 Pr(>F) 1.490e-12 Residuals 48 11354 a) What is the sample size in this study? b) Give the estimate of the standard deviation of the intrinsic error. c) Give the values of the t-test statistics for testing Họ : Bo = 0 vs. Ha : Bo # 0 and Ho : B1 = 0 vs. Ha : B1 7 0. What are the corresponding p-values?
Estimat (Intercept) -17.5791 6.7584 -2.601 0.0123 3.9324 0.4155 9.464 1.49e-12 Multiple R-squared: 0.6511 Analysis of Variance Table Df Sum Sq Mean Sq F value 1 21186 Pr(>F) 1.490e-12 Residuals 48 11354 a) What is the sample size in this study? b) Give the estimate of the standard deviation of the intrinsic error. c) Give the values of the t-test statistics for testing Họ : Bo = 0 vs. Ha : Bo # 0 and Ho : B1 = 0 vs. Ha : B1 7 0. What are the corresponding p-values?

Algebra & Trigonometry with Analytic Geometry
13th Edition
ISBN:9781133382119
Author:Swokowski
Publisher:Swokowski
Chapter3: Functions And Graphs
Section3.3: Lines
Problem 76E

Related questions
Question
100%
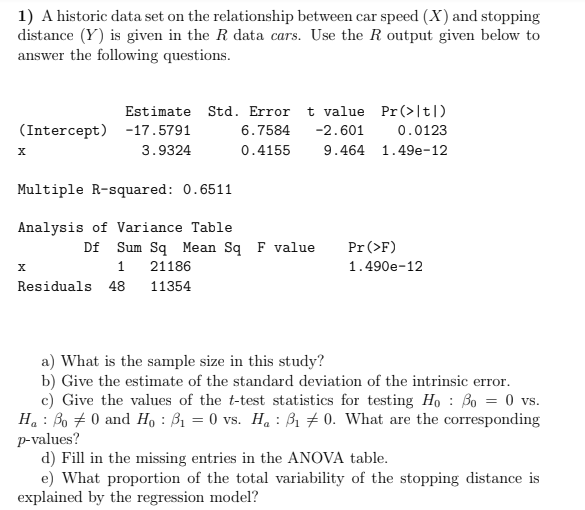
Transcribed Image Text:1) A historic data set on the relationship between car speed (X) and stopping
distance (Y) is given in the R data cars. Use the R output given below to
answer the following questions.
Estimate Std. Error t value Pr(>|t|)
(Intercept) -17.5791
6.7584
-2.601
0.0123
3.9324
0.4155
9.464 1.49e-12
Multiple R-squared: 0.6511
Analysis of Variance Table
Df Sum Sq Mean Sq F value
Pr (>F)
1
21186
1.490e-12
Residuals 48
11354
a) What is the sample size in this study?
b) Give the estimate of the standard deviation of the intrinsic error.
c) Give the values of the t-test statistics for testing Ho : Bo = 0 vs.
Ha : Bo + 0 and H, : B1 = 0 vs. Ha : B1 # 0. What are the corresponding
p-values?
d) Fill in the missing entries in the ANOVA table.
e) What proportion of the total variability of the stopping distance is
explained by the regression model?
Expert Solution
This question has been solved!
Explore an expertly crafted, step-by-step solution for a thorough understanding of key concepts.

Step by step
Solved in 2 steps

Follow-up Questions
Read through expert solutions to related follow-up questions below.
Follow-up Question
Fill in the missing entries in the ANOVA table.
e) What proportion of the total variability of the stopping distance is
explained by the regression model?
Solution
Follow-up Question
Fill in the missing entries in the ANOVA table.
e) What proportion of the total variability of the stopping distance is
explained by the regression model?
Solution
Follow-up Question
d) Fill in the missing entries in the ANOVA table.
e) What proportion of the total variability of the stopping distance is
explained by the regression model?
Solution
Recommended textbooks for you
Algebra & Trigonometry with Analytic Geometry
Algebra
ISBN:
9781133382119
Author:
Swokowski
Publisher:
Cengage

Glencoe Algebra 1, Student Edition, 9780079039897…
Algebra
ISBN:
9780079039897
Author:
Carter
Publisher:
McGraw Hill

Functions and Change: A Modeling Approach to Coll…
Algebra
ISBN:
9781337111348
Author:
Bruce Crauder, Benny Evans, Alan Noell
Publisher:
Cengage Learning
Algebra & Trigonometry with Analytic Geometry
Algebra
ISBN:
9781133382119
Author:
Swokowski
Publisher:
Cengage
Glencoe Algebra 1, Student Edition, 9780079039897…
Algebra
ISBN:
9780079039897
Author:
Carter
Publisher:
McGraw Hill
Functions and Change: A Modeling Approach to Coll…
Algebra
ISBN:
9781337111348
Author:
Bruce Crauder, Benny Evans, Alan Noell
Publisher:
Cengage Learning

Algebra and Trigonometry (MindTap Course List)
Algebra
ISBN:
9781305071742
Author:
James Stewart, Lothar Redlin, Saleem Watson
Publisher:
Cengage Learning