(d) Find the critical t-value that corresponds to 50% confidence. Assume 10 degrees of freedom. |(Round to three decimal places as needed.)
(d) Find the critical t-value that corresponds to 50% confidence. Assume 10 degrees of freedom. |(Round to three decimal places as needed.)

Chapter8: Sequences, Series,and Probability
Section8.7: Probability
Problem 4ECP: Show that the probability of drawing a club at random from a standard deck of 52 playing cards is...

Related questions
Question
Question #1 Part D
Transcribed Image Text:Area in
right tail
Table VI
t-Distribution
Area in Right Tail
df
0.25
0.20
0.15
0.10
0.05
0.025
0.02
0.01
0.005
0.0025
0.001
0.0005
1
0.816
3
6.314
2.920
2.353
2.132
2.015
12.706
4.303
3.182
2.776
2.571
15.894
4.849
3.482
2.999
2.757
31.821
6.965
4.541
3.747
63.657
9.925
5.841
4.604
4.032
127.321
14.089
7.453
5.598
4.773
318.309
22.327
10.215
7.173
5.893
636.619
31.599
12.924
8.610
6.869
1.000
1.376
1.963
1.386
1.250
1.190
3.078
1.061
0.978
0.941
2
1.886
0.765
0.741
0.727
1.638
1.533
1.476
4
5
0.920
1.156
3.365
0.906
0.896
0.889
0.883
5.959
5.408
5.041
4.781
1.134
2.447
3.143
2.998
2.896
2.821
2.764
6.
0.718
0.711
0.706
0.703
1.440
1.415
1.397
1.383
1.372
1.943
1.895
1.860
1.833
2.612
2.517
2.449
2.398
2.359
3.707
3.499
4.317
4.029
3.833
3.690
5.208
4.785
4.501
4.297
7
1.119
1.108
1.100
1.093
2.365
2.306
2.262
8
3.355
3.250
10
0.700
0.879
1.812
2.228
3.169
3.581
4.144
4.587
11
12
13
1.088
1.083
1.079
1.076
1.074
1.363
1.356
1.350
1.345
1.341
4.025
3.930
3.852
3.787
3.733
4.437
4.318
4.221
2.201
2.179
2.718
2.681
2.650
2.624
3.106
3.055
3.012
2.977
3.497
3.428
0.697
0.876
1.796
2.328
0.695
0.694
0.692
0.873
0.870
0.868
1.782
1.771
1.761
1.753
2.160
2.145
2.131
2.303
2.282
2.264
2.249
3.372
3.326
3.286
14
4.140
15
0.691
0.866
2.602
2.947
4.073
2.235
2.224
2.214
2.205
2.197
2.583
2.567
2.552
2.539
2.528
2.921
2.898
2.878
2.861
2.845
3.252
3.222
3.197
3.174
3.153
4.015
3.965
3.922
3.883
3.850
16
0.690
0.689
0.865
0.863
0.862
0.861
0.860
1.337
1.333
1.330
1.328
1.325
2.120
2.110
2.101
2.093
2.086
1.071
1.746
3.686
1.069
1.067
1.066
1.064
1.740
1.734
1.729
1.725
17
3.646
3.610
3.579
3.552
18
19
0.688
0.688
0.687
20
2.080
2.074
2.069
2.064
2.060
2.189
2.183
2.177
2.172
2.167
2.518
2.508
2.500
2.492
2.485
2.831
2.819
2.807
2.797
2.787
3.135
3.119
3.104
3.091
3.078
3.527
3.505
3.485
3.467
3.450
3.819
3.792
3.768
3.745
3.725
21
0.686
0.686
0.685
0.685
0.684
0.859
0.858
0.858
0.857
0.856
1.063
1.061
1.060
1.059
1.058
1.323
1.321
1.319
1.318
1.316
1.721
1.717
1.714
1.711
1.708
22
23
24
25
26
27
28
29
30
0.856
0.855
0.855
0.854
0.854
1.058
1.057
1.056
1.055
1.055
1.315
1.314
1.313
1.311
1.310
1.706
1.703
1.701
1.699
1.697
2.056
2.052
2.048
2.045
2.042
2.162
2.158
2.154
2.150
2.147
2.479
2.473
2.467
2.462
2.457
2.779
2.771
2.763
2.756
2.750
3.067
3.057
3.047
3.038
3.030
3.435
3.421
3.408
3.396
3.385
3.707
3.690
3.674
3.659
3.646
0.684
0.684
0.683
0.683
0.683
0.853
0.853
0.853
0.852
0.852
2.144
2.141
2.138
2.136
2.133
31
0.682
0.682
0.682
1.054
1.054
1.053
1.052
1.052
1.309
1.309
1.696
2.040
2.037
2.035
2.032
2.030
2.453
2.449
2.445
2.441
2.744
32
33
34
35
1.308
1.307
1.306
1.694
1.692
1.691
1.690
2.738
2.733
2.728
2.724
3.022
3.015
3.008
3.002
2.996
3.375
3.365
3.356
3.348
3.340
3.633
3.622
3.611
3.601
3.591
0.682
0.682
2.438
3.582
3.574
3.566
36
0.681
0.852
2.131
1.052
1.051
1.306
1.305
1.304
1.688
2.028
2.434
2.719
2.715
2.712
2.708
2.704
2.990
2.985
2.980
3.333
3.326
37
38
0.851
0.851
2.129
2.127
2.125
2.123
2.431
2.429
2.426
2.423
0.681
1.687
2.026
1.051
0.851 1.050
0.851
1.686
1.685
0.681
2.024
2.023
2.021
3.319
1.304
1.303
3.313
3.307
39
0.681
2.976
3.558
40
0.681
1.050
1.684
2.971
3.551
0.679
0.679
0.678
0.678
0.849
0.848
0.847
0.846
1.047
1.045
1.044
1.043
1.299
1.296
1.294
1.292
1.676
1.671
1.667
1.664
2.009
2.000
1.994
1.990
2.109
2.099
2.093
2.088
2.403
2.390
2.381
2.374
2.678
2.660
2.648
2.639
3.261
3.232
3.211
3.195
3.496
3.460
3.435
3.416
50
2.937
2.915
2.899
2.887
60
70
80
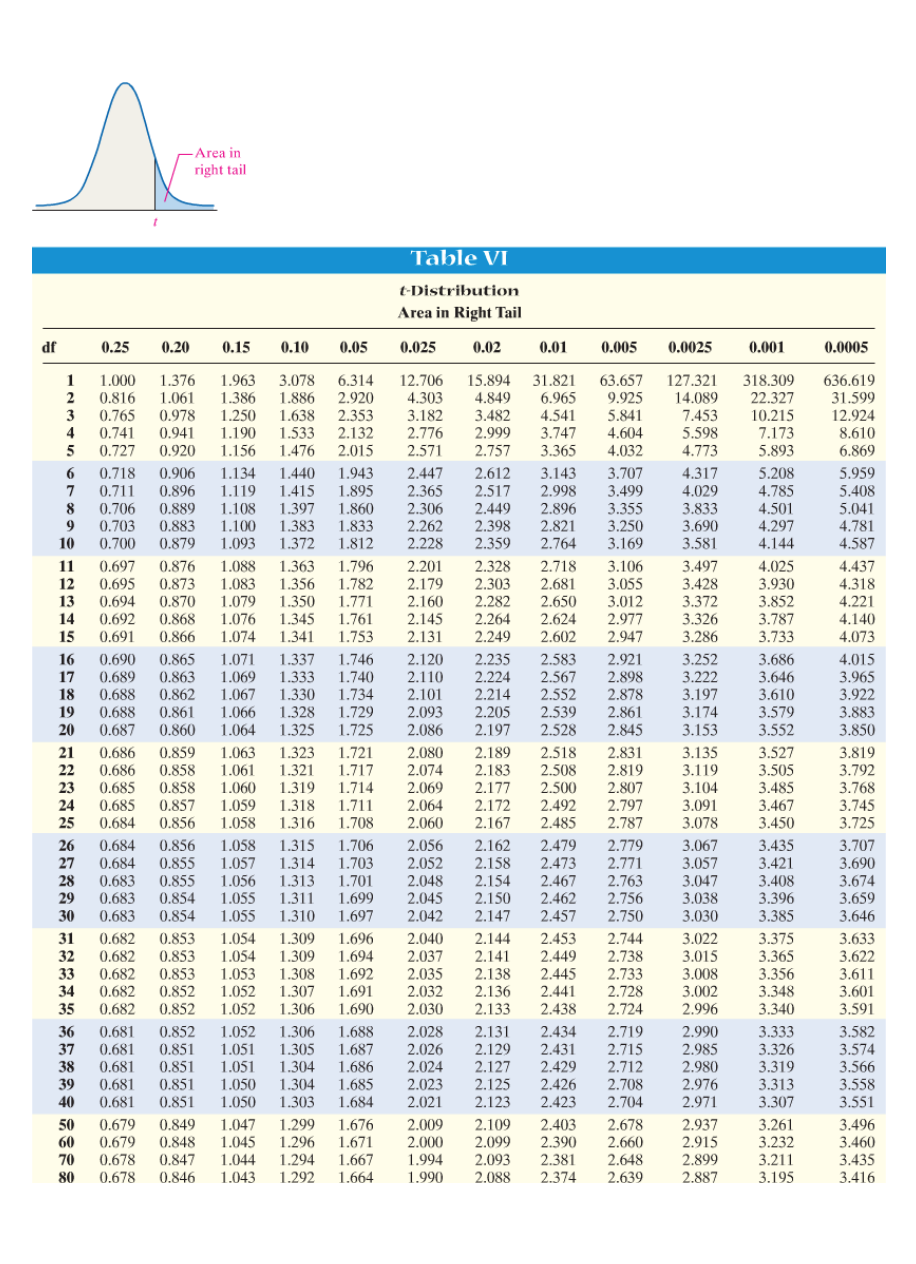
![Determine the t-value in each of the cases.
Click the icon to view the table of areas under the t-distribution.
.....
(a) Find the t-value such that the area in the right tail is 0.05 with 11 degrees of freedom.
1.796 (Round to three decimal places as needed.)
(b) Find the t-value such that the area in the right tail is 0.005 with 7 degrees of freedom.
3.499 (Round to three decimal places as needed.)
(c) Find the t-value such that the area left of the t-value is 0.20 with 22 degrees of freedom. [Hint: Use symmetry.]
- 0.858 (Round to three decimal places as needed.)
(d) Find the critical t-value that corresponds to 50% confidence. Assume 10 degrees of freedom.
(Round to three decimal places as needed.)](/v2/_next/image?url=https%3A%2F%2Fcontent.bartleby.com%2Fqna-images%2Fquestion%2Fb3687cbc-fe37-486e-87e6-a5fec1076243%2F83060118-fd58-4334-8c4c-8af98232aaff%2Fftyusj_processed.png&w=3840&q=75)
Transcribed Image Text:Determine the t-value in each of the cases.
Click the icon to view the table of areas under the t-distribution.
.....
(a) Find the t-value such that the area in the right tail is 0.05 with 11 degrees of freedom.
1.796 (Round to three decimal places as needed.)
(b) Find the t-value such that the area in the right tail is 0.005 with 7 degrees of freedom.
3.499 (Round to three decimal places as needed.)
(c) Find the t-value such that the area left of the t-value is 0.20 with 22 degrees of freedom. [Hint: Use symmetry.]
- 0.858 (Round to three decimal places as needed.)
(d) Find the critical t-value that corresponds to 50% confidence. Assume 10 degrees of freedom.
(Round to three decimal places as needed.)
Expert Solution
This question has been solved!
Explore an expertly crafted, step-by-step solution for a thorough understanding of key concepts.

This is a popular solution!

Trending now
This is a popular solution!

Step by step
Solved in 2 steps

Recommended textbooks for you