d. For a random sample of size 3, what is the chance that the sample mean will equal the population mean? The probability is (Type an integer or a decimal. Use the answers from part (a) and part (b) to find this answer.)
d. For a random sample of size 3, what is the chance that the sample mean will equal the population mean? The probability is (Type an integer or a decimal. Use the answers from part (a) and part (b) to find this answer.)

Related questions
Question
I need help with d
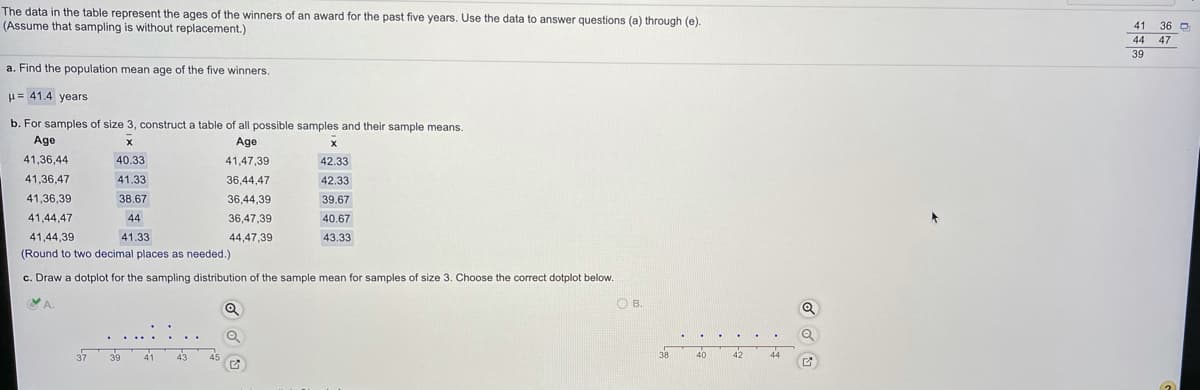
Transcribed Image Text:The data in the table represent the ages of the winners of an award for the past five years. Use the data to answer questions (a) through (e).
(Assume that sampling is without replacement.)
41 36 O
47
44
39
a. Find the population mean age of the five winners.
u= 41.4 years
b. For samples of size 3, construct a table of all possible samples and their sample means.
Age
Age
41,36,44
40.33
41,47,39
42.33
41,36,47
41.33
36,44,47
42.33
41,36,39
38.67
36,44,39
39.67
41,44,47
44
36,47,39
40.67
41,44,39
41.33
44,47,39
43.33
(Round to two decimal places as needed.)
c. Draw a dotplot for the sampling distribution of the sample mean for samples of size 3. Choose the correct dotplot below.
A.
O B.
38
40
42
44
37
39
41
43
45
Transcribed Image Text:Question Help v
The data in the table represent the ages of the winners of an award for the past five years. Use the data to answer questions (a) through (e).
(Assume that sampling is without replacement.)
36 O
44 47
39
41
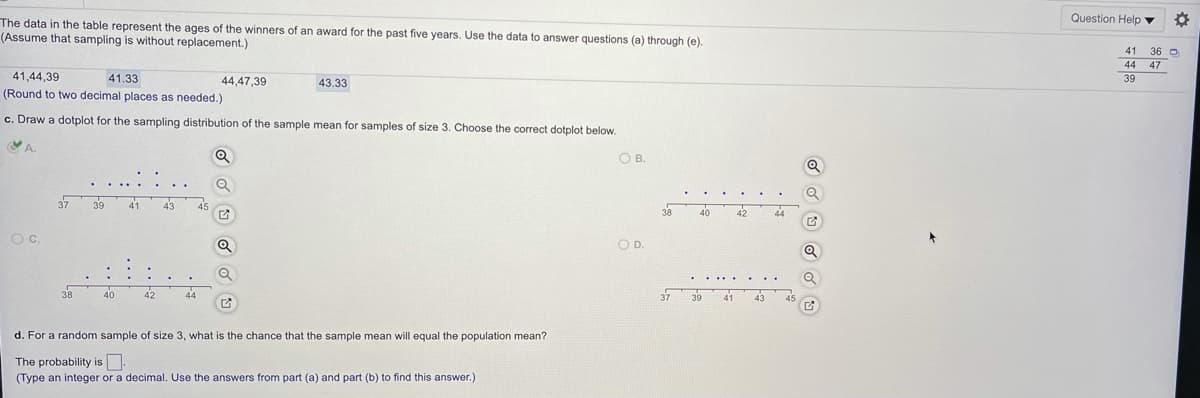
41,44,39
41.33
44,47,39
43.33
(Round to two decimal places as needed.)
c. Draw a dotplot for the sampling distribution of the sample mean for samples of size 3. Choose the correct dotplot below.
OB.
39
40
42
Oc.
OD.
38
40
44
37 39
42
d. For a random sample of size 3, what is the chance that the sample mean will equal the population mean?
The probability is
(Type an integer or a decimal. Use the answers from part (a) and part (b) to find this answer.)
Expert Solution
This question has been solved!
Explore an expertly crafted, step-by-step solution for a thorough understanding of key concepts.

This is a popular solution!

Trending now
This is a popular solution!

Step by step
Solved in 2 steps

Knowledge Booster


Learn more about
Need a deep-dive on the concept behind this application? Look no further. Learn more about this topic, statistics and related others by exploring similar questions and additional content below.