Daily Spot Exchange Rate, U.s. Dollars per Pound Sterling Date Rate Date Rate Date Rate 1-Apr-04 1.8664 13-Apr-04 1.8260 1.7674 23-Apr-84 26-Apr-04 27-Apr-84 28-Apr-04 29-Apr-84 38-Apr-04 3-May-84 4-May-04 21-May-84 24-May-84 25- May-04 26-May-04 27-May-04 28-May-04 2-Apr-e4 5-Apr-04 1.8393 14-Apr-84 1.77e2 1.7857 1.8140 15-Apr-04 1.7785 1.7925 6-Apr-84 1.8474 16-Apr-04 1.8104 1.7720 1.7856 7-Apr-84 8-Apr-84 9-Apr-04 12-Apr-04 5-May-84 6-May-04 7-May-84 10-May-04 11-May-84 12-May-84 1.8410 19-Apr-04 1.8ess 1.8425 20-Apr-84 1.7916 1.7844 1.8322 21-Apr-04 1.7620 1.7720 1.8458 22-Apr-04 1.7684 1.7607 13-May-04 14-May-04 17-May-04 18-May-04 19-Мay-84 20-May-84 1.7732 1.7554 1.788e 1.7841 1.7592 1.7908 1.7942 1.7595 1.8635 1.7823 1.7795 1.8342 1.7644 1.7827 1.8769 1.7743 1.7610 1.8530 Click here for the Excel Data File (a) Make a line chart and fit an m-perlod moving average to the exchange rate data shown above with m=2,3, 4, and 5 periods. For each method, state the last MA value. (Round your answers to 4 decimal places.) Next period forecast m-period (b) Which value of m do you prefer? The preferred m value is (Click to select) ♥. This value of mUsing this allows one to forecast the weekly or monthly trends [Click to select)* dally fluctuations. Joverreacting to (c) Is a moving average appropriate for this kind of data? LIGlick to select) a moving average is rClick to select) Y
Daily Spot Exchange Rate, U.s. Dollars per Pound Sterling Date Rate Date Rate Date Rate 1-Apr-04 1.8664 13-Apr-04 1.8260 1.7674 23-Apr-84 26-Apr-04 27-Apr-84 28-Apr-04 29-Apr-84 38-Apr-04 3-May-84 4-May-04 21-May-84 24-May-84 25- May-04 26-May-04 27-May-04 28-May-04 2-Apr-e4 5-Apr-04 1.8393 14-Apr-84 1.77e2 1.7857 1.8140 15-Apr-04 1.7785 1.7925 6-Apr-84 1.8474 16-Apr-04 1.8104 1.7720 1.7856 7-Apr-84 8-Apr-84 9-Apr-04 12-Apr-04 5-May-84 6-May-04 7-May-84 10-May-04 11-May-84 12-May-84 1.8410 19-Apr-04 1.8ess 1.8425 20-Apr-84 1.7916 1.7844 1.8322 21-Apr-04 1.7620 1.7720 1.8458 22-Apr-04 1.7684 1.7607 13-May-04 14-May-04 17-May-04 18-May-04 19-Мay-84 20-May-84 1.7732 1.7554 1.788e 1.7841 1.7592 1.7908 1.7942 1.7595 1.8635 1.7823 1.7795 1.8342 1.7644 1.7827 1.8769 1.7743 1.7610 1.8530 Click here for the Excel Data File (a) Make a line chart and fit an m-perlod moving average to the exchange rate data shown above with m=2,3, 4, and 5 periods. For each method, state the last MA value. (Round your answers to 4 decimal places.) Next period forecast m-period (b) Which value of m do you prefer? The preferred m value is (Click to select) ♥. This value of mUsing this allows one to forecast the weekly or monthly trends [Click to select)* dally fluctuations. Joverreacting to (c) Is a moving average appropriate for this kind of data? LIGlick to select) a moving average is rClick to select) Y

Algebra & Trigonometry with Analytic Geometry
13th Edition
ISBN:9781133382119
Author:Swokowski
Publisher:Swokowski
Chapter10: Sequences, Series, And Probability
Section10.3: Geometric Sequences
Problem 77E

Related questions

Topic Video
Question
Hi I need help with this practice question
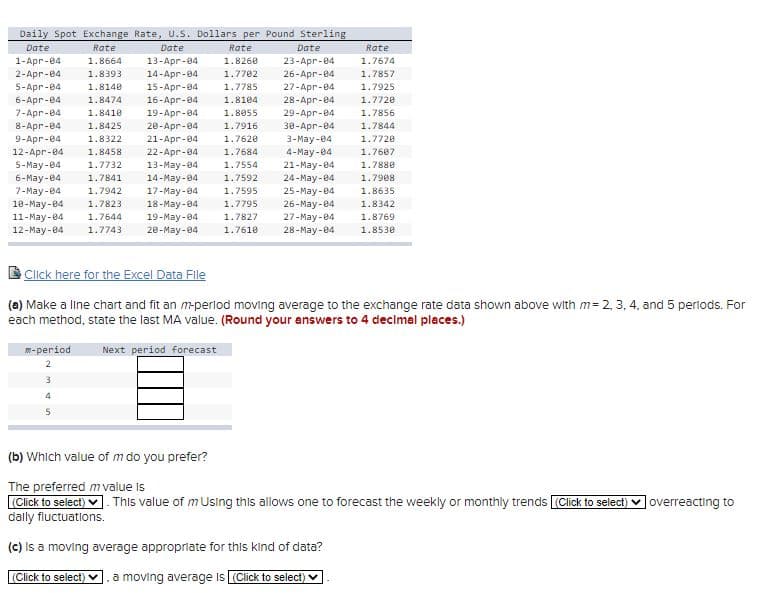
Transcribed Image Text:Daily Spot Exchange Rate, U.S. Dollars per Pound Sterling
Date
Rate
Date
Rate
Date
Rate
1-Apr-04
2-Apr-04
5-Apr-04
1.8664
13-Apr-84
1.8260
23-Apr-04
1.7674
1.8393
1.7702
1.7857
14-Apr-04
15-Apr-04
16-Apr-04
19-Apr-04
26-Apr-04
27-Apr-84
28-Аpг-84
29-Apr-84
30-Apr-84
1.8140
1.7785
1.7925
1.8104
1.7720
6-Apr-04
7-Apr-04
8-Apr-04
9-Apr-04
12-Apr-84
5-May -04
1.8474
1.8410
1.8055
1.7856
1.8425
1.7844
20-Apr-04
21-Apr-04
22-Apr-04
13-May-04
14-May-04
17-May-04
1.7916
3-May -04
4-May-04
21-May-84
24-May-04
25-May-04
26-May-84
1.8322
1.7620
1.7720
1.8458
1.7684
1.7607
1.7732
1.7554
1.7880
6-May-04
1.7841
1.7592
1.7908
7-May-04
1.7942
1.7595
1.8635
18-May-84
1.7823
1.7795
18-May-04
19-Мay-84
20-May-04
1.8342
11-May-84
1.7644
1.7827
27-May-04
1.8769
12-May-84
1.7743
1.7610
28-May -84
1.8530
Click here for the Excel Data File
(e) Make a line chart and fit an mperlod moving average to the exchange rate data shown above with m= 2, 3, 4, and 5 perlods. For
each method, state the last MA value. (Round your answers to 4 decimal places.)
m-period
Next period forecast
2
4
(b) Which value of m do you prefer?
The preferred mvalue is
(Click to select) v. This value of mUsing this allows one to forecast the weekly or monthly trends Click to select) v overreacting to
dally fluctuatlons.
(c) Is a moving average appropriate for this kind of data?
(Click to select) v
a moving average is (Click to select) v
Expert Solution
This question has been solved!
Explore an expertly crafted, step-by-step solution for a thorough understanding of key concepts.

This is a popular solution!

Trending now
This is a popular solution!

Step by step
Solved in 2 steps with 3 images

Knowledge Booster


Learn more about
Need a deep-dive on the concept behind this application? Look no further. Learn more about this topic, statistics and related others by exploring similar questions and additional content below.Recommended textbooks for you
Algebra & Trigonometry with Analytic Geometry
Algebra
ISBN:
9781133382119
Author:
Swokowski
Publisher:
Cengage

College Algebra
Algebra
ISBN:
9781305115545
Author:
James Stewart, Lothar Redlin, Saleem Watson
Publisher:
Cengage Learning
Algebra & Trigonometry with Analytic Geometry
Algebra
ISBN:
9781133382119
Author:
Swokowski
Publisher:
Cengage
College Algebra
Algebra
ISBN:
9781305115545
Author:
James Stewart, Lothar Redlin, Saleem Watson
Publisher:
Cengage Learning