data: FieldA and FieldB df- 34.751, p-value 0.001292 alternative hypothesis: true difference in means is not equal to 0 95 percent conf dence interval: sample estimates: mean of x mean of y 13.98803 11.02686 2. Based on the summary statistics calculate the missing t test statistic from the R output:
data: FieldA and FieldB df- 34.751, p-value 0.001292 alternative hypothesis: true difference in means is not equal to 0 95 percent conf dence interval: sample estimates: mean of x mean of y 13.98803 11.02686 2. Based on the summary statistics calculate the missing t test statistic from the R output:

Algebra & Trigonometry with Analytic Geometry
13th Edition
ISBN:9781133382119
Author:Swokowski
Publisher:Swokowski
Chapter5: Inverse, Exponential, And Logarithmic Functions
Section: Chapter Questions
Problem 12DE

Related questions
Question
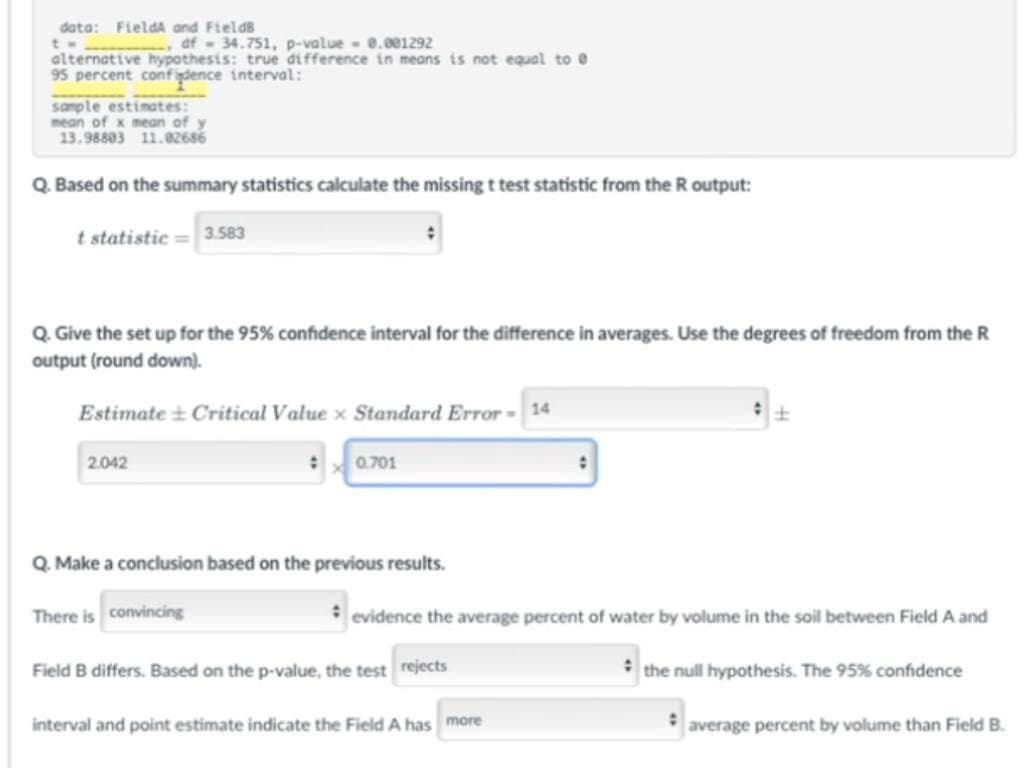
Transcribed Image Text:data: FieldA and Fields
af- 34.751, p-value e.001292
alternative hypothesis: true difference in means is not equal to 0
95 percent conf dence interval:
sample estimates:
mean of x mean of
13.98803 11.02686
Q. Based on the summary statistics calculate the missing t test statistic from the R output:
t statistic = 3.583
Q. Give the set up for the 95% confidence interval for the difference in averages. Use the degrees of freedom from the R
output (round down).
Estimate ± Critical Value × Standard Error - 14
2.042
0.701
Q. Make a conclusion based on the previous results.
There is convincing
evidence the average percent of water by volume in the soil between Field A and
Field B differs. Based on the p-value, the test rejects
* the null hypothesis. The 95% confidence
interval and point estimate indicate the Field A has more
average percent by volume than Field B.
Expert Solution
This question has been solved!
Explore an expertly crafted, step-by-step solution for a thorough understanding of key concepts.

This is a popular solution!

Trending now
This is a popular solution!

Step by step
Solved in 2 steps

Recommended textbooks for you
Algebra & Trigonometry with Analytic Geometry
Algebra
ISBN:
9781133382119
Author:
Swokowski
Publisher:
Cengage
Algebra & Trigonometry with Analytic Geometry
Algebra
ISBN:
9781133382119
Author:
Swokowski
Publisher:
Cengage