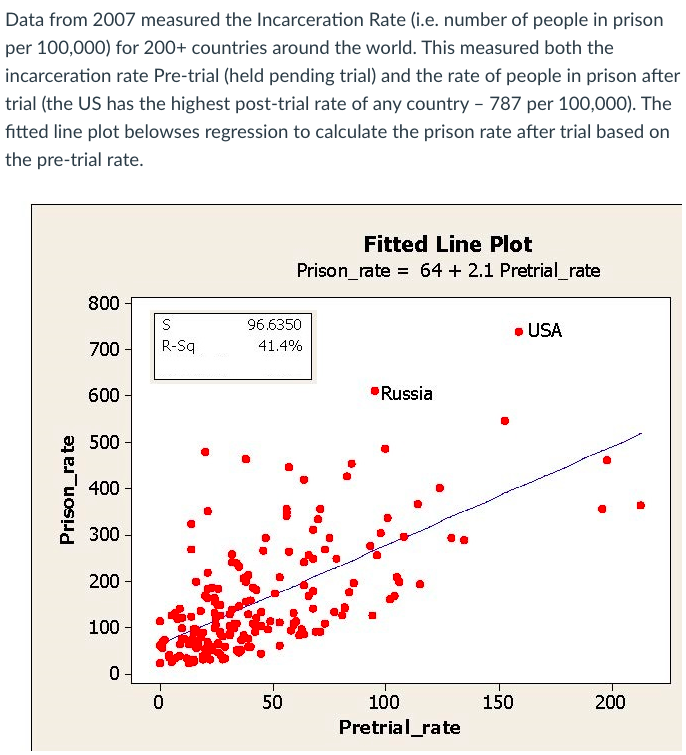
Data from 2007 measured the Incarceration Rate (i.e. number of people in prison per 100,000) for 200+ countries around the world. This measured both the incarceration rate Pre-trial (held pending trial) and the rate of people in prison after trial (the US has the highest post-trial rate of any country - 787 per 100,000). The fitted line plot belowses regression to calculate the prison rate after trial based on the pre-trial rate. Fitted Line Plot Prison_rate= 64 + 2.1 Pretrial_rate 800 • USA 700 600 Russia 500 400 300 200 100 0 Prison_rate S R-Sq 0 96.6350 41.4% ● 50 000 *. 100 Protrial rato 150 ● 200
Data from 2007 measured the Incarceration Rate (i.e. number of people in prison per 100,000) for 200+ countries around the world. This measured both the incarceration rate Pre-trial (held pending trial) and the rate of people in prison after trial (the US has the highest post-trial rate of any country - 787 per 100,000). The fitted line plot belowses regression to calculate the prison rate after trial based on the pre-trial rate. Fitted Line Plot Prison_rate= 64 + 2.1 Pretrial_rate 800 • USA 700 600 Russia 500 400 300 200 100 0 Prison_rate S R-Sq 0 96.6350 41.4% ● 50 000 *. 100 Protrial rato 150 ● 200

Glencoe Algebra 1, Student Edition, 9780079039897, 0079039898, 2018
18th Edition
ISBN:9780079039897
Author:Carter
Publisher:Carter
Chapter4: Equations Of Linear Functions
Section: Chapter Questions
Problem 4SGR

Related questions
Question
Iran has a Pre-Trial rate of 40. What is its predicted Post-Trial Prison Rate? Round your answer to two decimal places and do not include units.
Transcribed Image Text:Data from 2007 measured the Incarceration Rate (i.e. number of people in prison
per 100,000) for 200+ countries around the world. This measured both the
incarceration rate Pre-trial (held pending trial) and the rate of people in prison after
trial (the US has the highest post-trial rate of any country - 787 per 100,000). The
fitted line plot belowses regression to calculate the prison rate after trial based on
the pre-trial rate.
Fitted Line Plot
Prison_rate= 64 + 2.1 Pretrial_rate
800
• USA
700
600
Russia
500
400
300
200
100
0
Prison_rate
S
R-Sq
0
96.6350
41.4%
●
50
000
..
100
Pretrial_rate
150
●
200
Expert Solution
This question has been solved!
Explore an expertly crafted, step-by-step solution for a thorough understanding of key concepts.

This is a popular solution!

Trending now
This is a popular solution!

Step by step
Solved in 2 steps

Recommended textbooks for you
Glencoe Algebra 1, Student Edition, 9780079039897…
Algebra
ISBN:
9780079039897
Author:
Carter
Publisher:
McGraw Hill


Algebra & Trigonometry with Analytic Geometry
Algebra
ISBN:
9781133382119
Author:
Swokowski
Publisher:
Cengage
Glencoe Algebra 1, Student Edition, 9780079039897…
Algebra
ISBN:
9780079039897
Author:
Carter
Publisher:
McGraw Hill
Algebra & Trigonometry with Analytic Geometry
Algebra
ISBN:
9781133382119
Author:
Swokowski
Publisher:
Cengage

Trigonometry (MindTap Course List)
Trigonometry
ISBN:
9781305652224
Author:
Charles P. McKeague, Mark D. Turner
Publisher:
Cengage Learning

Functions and Change: A Modeling Approach to Coll…
Algebra
ISBN:
9781337111348
Author:
Bruce Crauder, Benny Evans, Alan Noell
Publisher:
Cengage Learning

Algebra and Trigonometry (MindTap Course List)
Algebra
ISBN:
9781305071742
Author:
James Stewart, Lothar Redlin, Saleem Watson
Publisher:
Cengage Learning