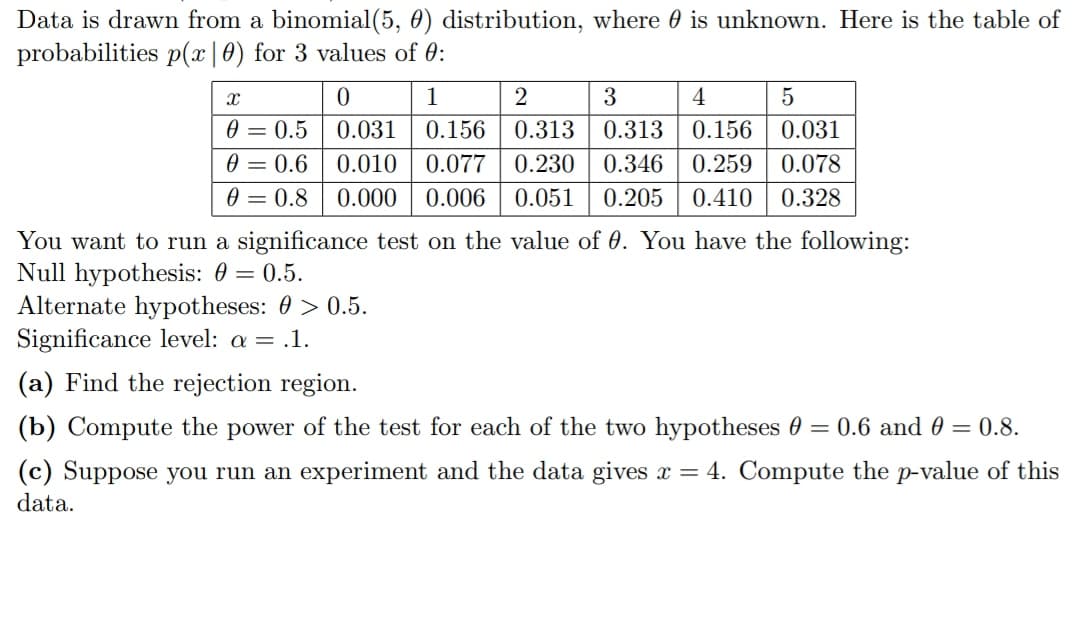
Data is drawn from a binomial (5, 0) distribution, where is unknown. Here is the table of probabilities p(x|0) for 3 values of 0: X 0 1 0 = 0.5 0.031 0.156 0 = 0.6 0.010 0.077 0 = 0.8 0.000 0.006 2 3 4 5 0.313 0.313 0.156 0.031 0.230 0.346 0.259 0.078 0.051 0.205 0.410 0.328 You want to run a significance test on the value of 0. You have the following: Null hypothesis: 0 = 0.5. Alternate hypotheses: >0.5. Significance level: a = .1. (a) Find the rejection region. (b) Compute the power of the test for each of the two hypotheses 0 = 0.6 and 0 = 0.8. (c) Suppose you run an experiment and the data gives x = 4. Compute the p-value of this data.
Data is drawn from a binomial (5, 0) distribution, where is unknown. Here is the table of probabilities p(x|0) for 3 values of 0: X 0 1 0 = 0.5 0.031 0.156 0 = 0.6 0.010 0.077 0 = 0.8 0.000 0.006 2 3 4 5 0.313 0.313 0.156 0.031 0.230 0.346 0.259 0.078 0.051 0.205 0.410 0.328 You want to run a significance test on the value of 0. You have the following: Null hypothesis: 0 = 0.5. Alternate hypotheses: >0.5. Significance level: a = .1. (a) Find the rejection region. (b) Compute the power of the test for each of the two hypotheses 0 = 0.6 and 0 = 0.8. (c) Suppose you run an experiment and the data gives x = 4. Compute the p-value of this data.

College Algebra
7th Edition
ISBN:9781305115545
Author:James Stewart, Lothar Redlin, Saleem Watson
Publisher:James Stewart, Lothar Redlin, Saleem Watson
Chapter9: Counting And Probability
Section9.3: Binomial Probability
Problem 2E: If a binomial experiment has probability p success, then the probability of failure is...

Related questions
Question
Transcribed Image Text:Data is drawn from a binomial (5, 0) distribution, where is unknown. Here is the table of
probabilities p(x|0) for 3 values of 0:
X
0
1
0 = 0.5
0.031
0.156
0 = 0.6
0.010
0.077
0 = 0.8 0.000 0.006
2
3
4
5
0.313
0.313
0.156
0.031
0.230
0.346 0.259 0.078
0.051 0.205 0.410 0.328
You want to run a significance test on the value of 0. You have the following:
Null hypothesis: 0 = 0.5.
Alternate hypotheses: >0.5.
Significance level: a = .1.
(a) Find the rejection region.
(b) Compute the power of the test for each of the two hypotheses 0 = 0.6 and 0 = 0.8.
(c) Suppose you run an experiment and the data gives x = 4. Compute the p-value of this
data.
Expert Solution
This question has been solved!
Explore an expertly crafted, step-by-step solution for a thorough understanding of key concepts.

This is a popular solution!

Trending now
This is a popular solution!

Step by step
Solved in 4 steps with 4 images

Recommended textbooks for you
College Algebra
Algebra
ISBN:
9781305115545
Author:
James Stewart, Lothar Redlin, Saleem Watson
Publisher:
Cengage Learning
College Algebra
Algebra
ISBN:
9781305115545
Author:
James Stewart, Lothar Redlin, Saleem Watson
Publisher:
Cengage Learning