Data Management - Statisitcal Analysis Describe each graph seperately. Explain the type of graph with description of variables as well as any visual trend/relation in data.


Q: Let X₁, X2,..., X50 be a random sample of size 50 from a distribution with density е for 0<x<∞ f(x)…
A: Given f(x)=1/θ*e-x/θ n=50 Farmula used E(x̄)=E(x) V(x̄)=σ2/n
Q: Can anyone please help with F, G, and H? The
A: From the given information, the best model is quadratic model. The equation is,…
Q: Find the conditional density functions for the joint density function fxy(x, y) = 4xy e¯(x²+y²)…
A:
Q: 4. A survey by Women's Health magazine stated that 20% of women said they used exercise to reduce…
A:
Q: A real-estate agent conducted an experiment to test the effect of selling a staged home vs. selling…
A:
Q: The college is planning to add a food vender in the student union and would like to know what type…
A: Given n=3
Q: The file winter.mwx can be used to produce a contingency table giving the count of all competitors…
A:
Q: IQ scores are normally distributed with a mean of 100 and a standard deviation of 17. Assume that…
A: Given Mean=100 Standard deviations=17
Q: 5. Suppose that you are deciding whether to take Professor Fisher's class or Professor Savage's next…
A: Since you have posted a question with multiple sub-parts, we will solve first three subparts for…
Q: 49' class is shown in Figure 1. RUN mpetitors in the '40 to CYCLE SKI Run, cycle and ski times for…
A:
Q: The time required to finish an assembly job is believed to be normally distributed with a standard…
A: here given , standard deviation = σ = 16 minute
Q: A study in which two family medicine residents are evaluating the usefulness of a series of 210 noon…
A: The following information has been given: RESIDENT 1 TOTAL YES NO RESIDENT 2 YES…
Q: A general contracting firm experiences cost overruns on 25% of its contracts. In a company audit, 20…
A: Here given , A general contracting firm experiences cost overruns on 25% of its contracts. In a…
Q: 5/25/22, 12:45 PM Statistics - MA3113 B-IC-Edgenuity.com A shipping company claims that 95% of…
A: Given: 00-04 = Package not delivered on time 05-99 = Packages delivered on time
Q: The salaries of professional baseball players are heavily skewed right with a mean of $3.2 million…
A: From the provided information,
Q: STEP 1. Arrange the data in ascending order. STEP 2. DETERMINE THE CLASSES. FIND/SOLVE THE…
A: Given data…
Q: Two random variables X and Y have mean values X = 1 and Y = 1, variances o² = 4 ando,² = 2 and a…
A:
Q: is asked to send four employees who have positive indications r for further testing. Suppose 40% of…
A: *Answer:
Q: If the sample size is n=81, find the mean and standard deviation of the distribution of sample…
A: It is given that X = IQ scores ~ N(mean = 95, SD = 18)
Q: 10. Suppose approximately 95 % of people who wrote a standardised test had marks that ranged from 78…
A: here given , Suppose approximately 95 % of people who wrote a standardised test had marks that…
Q: The data in the following table show the outcomes of guilty and not-guilty pleas in 1,022 criminal…
A:
Q: Problem 6-01 (Algorithmic) Consider the following time series data. Week 1 2 3 4 5 6 Value 20 12 16…
A:
Q: A study of a local high school tried to determine the mean amount of money that each student had…
A:
Q: An appropriate measure of association for wondering whether gender (male =1, female =2) has an…
A: We have to determine the measure of association between gender and happiness.
Q: 2. A group of students working on their thesis took a random sample of 100 families in a certain…
A: Given Sample size=100, sample mean x̄=1146, sample standard deviations s=650 Construct 90% CI for…
Q: In a survey of high school seniors, 72% of those surveyed stated they were planning on attending…
A: Given: Percent of high school seniors stated that they were planning on attending college is = 72%…
Q: Transport engineers are interested to study the pattern and the risk of accidents at a junction.…
A: The question is about goodness of fit Given :
Q: State Debt and Per Capita Taxes Data for per capita state debt and per capita state tax for five…
A: The following information has been given: x (Per capita debt) y (per capita tax) 2176 1910…
Q: Look at the figure below, which shows four residual plots labelled (a), (b), (c) and (d). Each…
A: The objective is to give a reasonable interpretation for each residual plot.
Q: A study was done to know if there is a relationship between obesity and atherosclerosis. A total of…
A: Given The total participants in the study =775The participants with atherosclerosis =312 Among these…
Q: The data below are from an independent-measures experiment comparing three different treatment…
A: The following information has been given: Treatment 1 Treatment 2 Treatment 3 0 1 4 0 4 3 0…
Q: 9. Sample data from the National Center for Health Statistics reveal that weights of American men…
A: Given Information: Men: Mean μ=175 Standard deviation σ=35 Women: Mean μ=140 Standard deviation σ=30
Q: Last year, television station WXYZ's share of the 11 P.M. news audience was approximately equal to,…
A: Introduction :- Given :- Surveyed a random sample of 400 11PM news viewers and found that 146…
Q: 6. Suppose it is up to you to determine if a certain state (New York) receives a significantly…
A:
Q: The college is planning to add a food vender in the student union and would like to know what type…
A: Given Coffee 53 Pizza. 37 Hamburger 30
Q: 4) a. A few mechanics on a Toyota showroom identified that they attend an average of (B+ A) cars per…
A: Formula :
Q: The amount of damage done by a named storm is impacted in part by the number of days the storm stays…
A:
Q: The weights of students in a certain school are normally distributed with a mean weight of 66 kg.…
A: Given problem is normal distribution. Let, X: Weight of students in a certain school Mean=66…
Q: Fill in the missing entries in the ANOVA table. e) What proportion of the total variability of the…
A: Anova used to explain the variation within and between various groups. It use F test to make…
Q: Fifteen fourth-grade students were randomly assigned to three groups to experiment with three…
A: The question is based on a ANOVA Given :
Q: Which one measure of central tendency should you report for the variable AGE (people write their…
A: Measures of central tendency: In statistics, some measures are used to find the middle value or…
Q: A carnival game is designed so that approximately 10% of players will win a large prize. If there is…
A: P-value = 0.0027
Q: Create a scatter plot for the data. Do you think there is a linear relationship between the two…
A: Scatter plot is used to determine the association between two variable. The variables used in…
Q: A large home improvement store is considering expanding its selection of moving products, such as…
A: Given that A large home improvement store is considering expanding its selection of moving…
Q: Out of a sample of 650 high school students, 321 take the bus to school every day. Construct a 99%…
A:
Q: Let X₁X and Y₁Ym follow the location model X₁ = 0₁ + Zi, i = 1,...,n Y₁ = 0₂ + Zn+i; i = 1, ..., m,…
A:
Q: n insurance agent knows that 18% of deer-car collision claims are filed in November. Consider a…
A:
Q: Paired t-test used to compare the means of a single group at 2 points in time and need normal…
A: It is given that the statement about to the paired t-test. Here, need to find out the given…
Q: A statistics class weighed 20 bags of grapes purchased from the store. The bags are advertised to…
A: From the provided information, Sample size (n) = 20 Confidence level = 90% Confidence interval =…
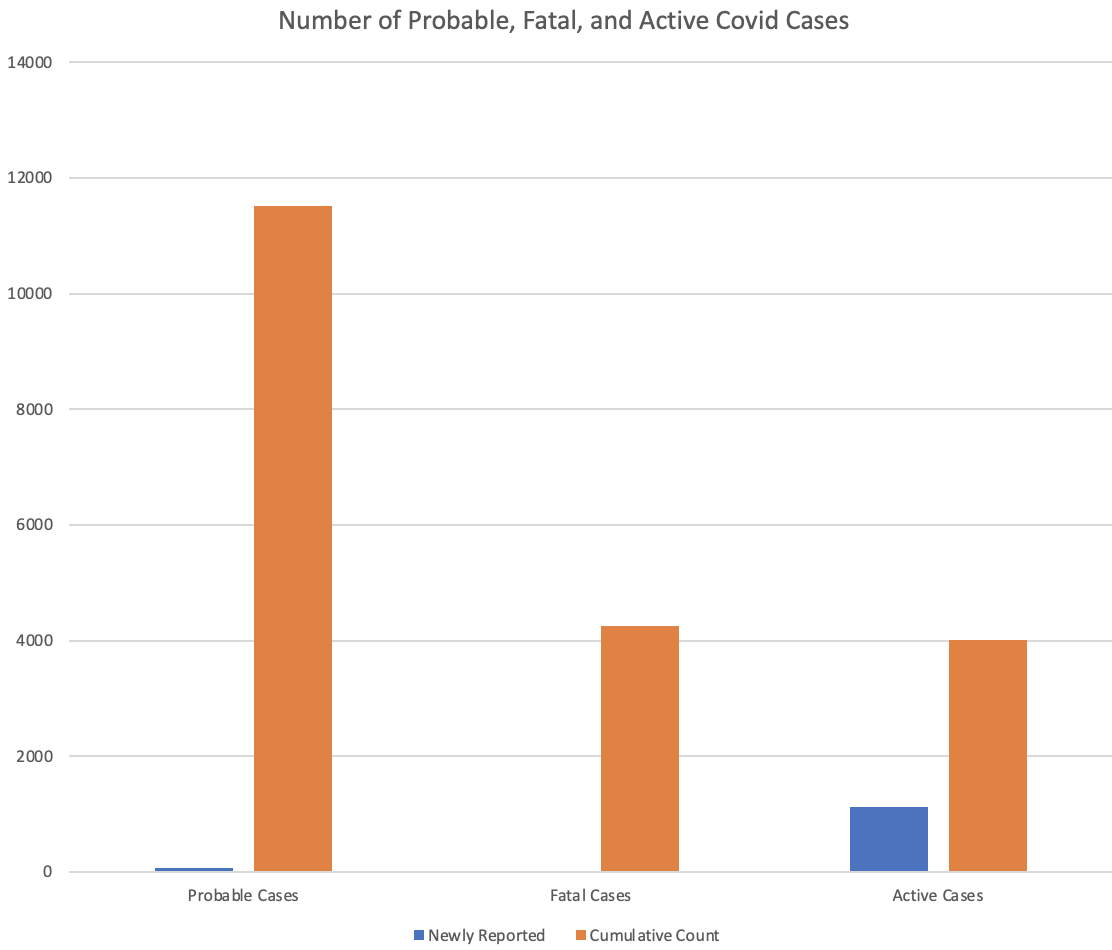
Data Management - Statisitcal Analysis
Describe each graph seperately. Explain the type of graph with description of variables as well as any visual trend/relation in data.

Step by step
Solved in 2 steps

- Applied Basic Statistics2: Mean and Var of lossWhat is not an advantage of a case study design? It treats the total study population as on entity, such as individuals, groups, communities or an event or instance. Multiple data collection methods can be used, such as interviews, focus groups and observations. That a single case provides in depth understanding of an event or situation. Findings can be generalized to the popilation the case was drawn from.
- Give an statistical principle example for a surgeonIf there is no seasonal effects on human births, we would expect equal numbers of children to be born in each season (winter, spring, summer, and fall). A student takes a census of her statistics class and finds that of the 120 students in the class, 25 were born in winter, 35 in spring, 32 in summer, and 28 in fall. She wonders if the excess in the spring is an indication that births are not uniform throughout the year. What is the chi-square statistic? What is the p-value? ( 3 decimal places) What is your decision? What is your conclusion in context?Chi square test of 20 families with four children
- A population characteristic is a quantity that summarizes a... A statistic is a quantity calculated from the values in a...A researcher is interested in the relationship between socioeconomic status (SES) and rates of preventable disease. The researcher uses ANOVA and breaks apart SES into three samples, which are Low SES, Middle SES, and High SES. In this study, SES is treated as a(n) ______ variable. Group of answer choices nominal ordinal interval ratioDiscuss the concept cases and formulas regarding Statistical Inference of TwoSamples.
- Question: A fair die is rolled 52 times. It was determined that the die rolled: one 9 times, two 4 times, three 10 times, four 11 times, five 11 times, and six 7 times. Determine the variance.Levene's test tests whether#5). The cumulative frequency of the second class is: The percentage of students who work less than 20 hours per week is: The data in the table are considered: Grouped Quantitative Discrete Qualitative Grouped Qualitative Ungrouped Quantitative