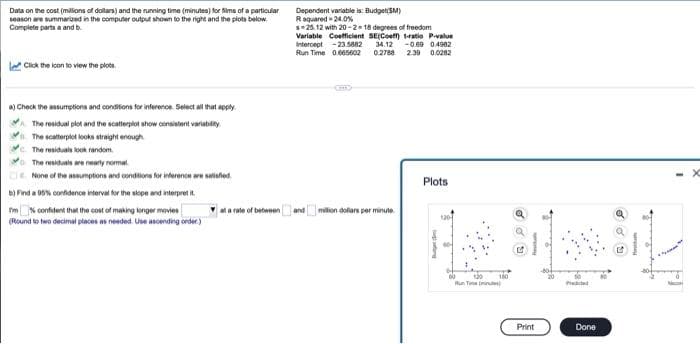
Data on the cost (millions of dollars) and the running time (minutes) for films of a particular season are summarized in the computer output shown to the right and the plots below. Complete parts a and b Click the icon to view the plots. Dependent variable is: Budget(M) Rsquared24.0% s 25.12 with 20-2-16 degrees of freedom Variable Coefficient SE(Coeff) t-ratio P-value Intercept -23.5882 34.12 -0.60 0.4982 2.30 0.0282 Run Time 0.665602 0.2788
Data on the cost (millions of dollars) and the running time (minutes) for films of a particular season are summarized in the computer output shown to the right and the plots below. Complete parts a and b Click the icon to view the plots. Dependent variable is: Budget(M) Rsquared24.0% s 25.12 with 20-2-16 degrees of freedom Variable Coefficient SE(Coeff) t-ratio P-value Intercept -23.5882 34.12 -0.60 0.4982 2.30 0.0282 Run Time 0.665602 0.2788

Glencoe Algebra 1, Student Edition, 9780079039897, 0079039898, 2018
18th Edition
ISBN:9780079039897
Author:Carter
Publisher:Carter
Chapter4: Equations Of Linear Functions
Section: Chapter Questions
Problem 6SGR

Related questions
Question
Transcribed Image Text:Data on the cost (millions of dollars) and the running time (minutes) for films of a particular
season are summarized in the computer output shown to the right and the plots below.
Complete parts a and b
Click the icon to view the plots.
a) Check the assumptions and conditions for inference Select all that apply
The residual plot and the scatterplot show consistent variability
The scatterplot looks straight enough
The residuals look random
The residuals are nearly normal
None of the assumptions and conditions for inference are satisfied.
b) Find a 95% confidence interval for the slope and interpret it.
m% confident that the cost of making longer movies
(Round to two decimal places as needed. Use ascending order.)
Dependent variable is: Budget(SM)
squared-24.0%
R
s 25.12 with 20-2-18 degrees of freedom
Variable Coefficient SE(Coeff) t-ratio P-value
intercept -23.5882
Run Time 0.665602 0.2788
34.12 -0.69 0.4982
2.39 0.0282
at a rate of between and milion dollars per minute
Plots
120
Run Time in
160
Print
Predded
Done
M
Expert Solution
This question has been solved!
Explore an expertly crafted, step-by-step solution for a thorough understanding of key concepts.

This is a popular solution!

Trending now
This is a popular solution!

Step by step
Solved in 2 steps with 2 images

Recommended textbooks for you
Glencoe Algebra 1, Student Edition, 9780079039897…
Algebra
ISBN:
9780079039897
Author:
Carter
Publisher:
McGraw Hill

Algebra & Trigonometry with Analytic Geometry
Algebra
ISBN:
9781133382119
Author:
Swokowski
Publisher:
Cengage
Glencoe Algebra 1, Student Edition, 9780079039897…
Algebra
ISBN:
9780079039897
Author:
Carter
Publisher:
McGraw Hill
Algebra & Trigonometry with Analytic Geometry
Algebra
ISBN:
9781133382119
Author:
Swokowski
Publisher:
Cengage