Data Presentation Techniques Name: Score: Course and Year: Date: A. Identify the most appropriate graph/chart for each scenario. 1. In 2018, the total volume of crop production of CAR is 235,420.0 metric tons. Here is the distribution per province: Abra: 14 820.8 (6%) Apayao: 11 815.0 (5%) Ifugao: 13 772.4 (6%) Kalinga: 30 986.2 (13%) Mountain Province: 10 712.6 (5%) Benguet: 153 313.1 (65%) 2. The following are the number of cancer patients in CAR since 1995: 1995: 50 2005: 125 2000: 75 2010: 100 2015: 150 2020: 175 3. Population density refers to the number of people per unit area. The following shows the population density per square kilometer of some selected regions of Luzon. CAR:87 II (Cagayan Valley):116 IV-A(CALABARZON):870 I (Ilocos):388 III (Central Luzon):512 IV-B (MIMAROPA):100 4. The following shows the passing rate of four universities during a recently concluded board exam. Benguet State University: 78% University of Baguio: 64% Saint Louis University: 82% University of the Cordilleras: 70% 5. A researcher aims to explore the relationship between Mathematics Proficiency (X) and Problem-Solving Performance (Y) of students. Here are their scores. X: 80 95 88 79 85 84 80 Y: 79 96 87 76 89 85 83 82 81 92 88 82 89 75 77 91 91 87 93 73 79 Graph/Chart
Data Presentation Techniques Name: Score: Course and Year: Date: A. Identify the most appropriate graph/chart for each scenario. 1. In 2018, the total volume of crop production of CAR is 235,420.0 metric tons. Here is the distribution per province: Abra: 14 820.8 (6%) Apayao: 11 815.0 (5%) Ifugao: 13 772.4 (6%) Kalinga: 30 986.2 (13%) Mountain Province: 10 712.6 (5%) Benguet: 153 313.1 (65%) 2. The following are the number of cancer patients in CAR since 1995: 1995: 50 2005: 125 2000: 75 2010: 100 2015: 150 2020: 175 3. Population density refers to the number of people per unit area. The following shows the population density per square kilometer of some selected regions of Luzon. CAR:87 II (Cagayan Valley):116 IV-A(CALABARZON):870 I (Ilocos):388 III (Central Luzon):512 IV-B (MIMAROPA):100 4. The following shows the passing rate of four universities during a recently concluded board exam. Benguet State University: 78% University of Baguio: 64% Saint Louis University: 82% University of the Cordilleras: 70% 5. A researcher aims to explore the relationship between Mathematics Proficiency (X) and Problem-Solving Performance (Y) of students. Here are their scores. X: 80 95 88 79 85 84 80 Y: 79 96 87 76 89 85 83 82 81 92 88 82 89 75 77 91 91 87 93 73 79 Graph/Chart

Holt Mcdougal Larson Pre-algebra: Student Edition 2012
1st Edition
ISBN:9780547587776
Author:HOLT MCDOUGAL
Publisher:HOLT MCDOUGAL
Chapter7: Percents
Section7.4: The Percent Equation
Problem 28E

Related questions
Question
Please help me answer this activity
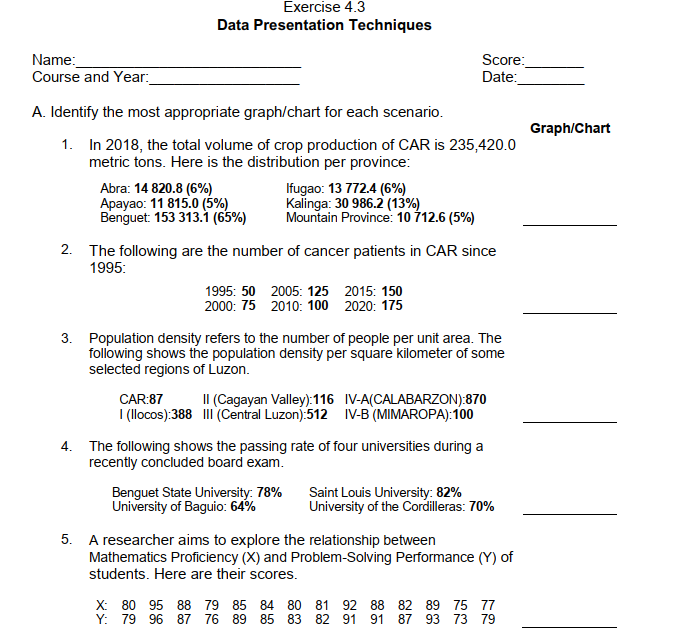
Transcribed Image Text:Exercise 4.3
Data Presentation Techniques
Name:
Score:
Course and Year:
Date:
A. Identify the most appropriate graph/chart for each scenario.
1. In 2018, the total volume of crop production of CAR is 235,420.0
metric tons. Here is the distribution per province:
Abra: 14 820.8 (6%)
Apayao: 11 815.0 (5%)
Ifugao: 13 772.4 (6%)
Kalinga: 30 986.2 (13%)
Mountain Province: 10 712.6 (5%)
Benguet: 153 313.1 (65%)
2. The following are the number of cancer patients in CAR since
1995:
1995: 50 2005: 125
2000: 75 2010: 100
2015: 150
2020: 175
3. Population density refers to the number of people per unit area. The
following shows the population density per square kilometer of some
selected regions of Luzon.
CAR:87
II (Cagayan Valley):116 IV-A(CALABARZON):870
I (llocos):388 III (Central Luzon):512 IV-B (MIMAROPA):100
4. The following shows the passing rate of four universities during a
recently concluded board exam.
Benguet State University: 78%
University of Baguio: 64%
Saint Louis University: 82%
University of the Cordilleras: 70%
5. A researcher aims to explore the relationship between
Mathematics Proficiency (X) and Problem-Solving Performance (Y) of
students. Here are their scores.
X: 80 95 88 79 85 84 80 81 92 88
Y: 79 96 87 76 89 85 83 82 91 91
82 89 75 77
87 93 73 79
Graph/Chart
Expert Solution
This question has been solved!
Explore an expertly crafted, step-by-step solution for a thorough understanding of key concepts.

This is a popular solution!

Trending now
This is a popular solution!

Step by step
Solved in 6 steps

Recommended textbooks for you
Holt Mcdougal Larson Pre-algebra: Student Edition…
Algebra
ISBN:
9780547587776
Author:
HOLT MCDOUGAL
Publisher:
HOLT MCDOUGAL

Glencoe Algebra 1, Student Edition, 9780079039897…
Algebra
ISBN:
9780079039897
Author:
Carter
Publisher:
McGraw Hill

Algebra: Structure And Method, Book 1
Algebra
ISBN:
9780395977224
Author:
Richard G. Brown, Mary P. Dolciani, Robert H. Sorgenfrey, William L. Cole
Publisher:
McDougal Littell
Holt Mcdougal Larson Pre-algebra: Student Edition…
Algebra
ISBN:
9780547587776
Author:
HOLT MCDOUGAL
Publisher:
HOLT MCDOUGAL
Glencoe Algebra 1, Student Edition, 9780079039897…
Algebra
ISBN:
9780079039897
Author:
Carter
Publisher:
McGraw Hill
Algebra: Structure And Method, Book 1
Algebra
ISBN:
9780395977224
Author:
Richard G. Brown, Mary P. Dolciani, Robert H. Sorgenfrey, William L. Cole
Publisher:
McDougal Littell

Big Ideas Math A Bridge To Success Algebra 1: Stu…
Algebra
ISBN:
9781680331141
Author:
HOUGHTON MIFFLIN HARCOURT
Publisher:
Houghton Mifflin Harcourt