Data show that men between the ages of 20 and 29 in a general population have a mean height of 69.3 inches, with a standard deviation of 2.6 inches. A baseball analyst wonders whether the standard deviation of heights of major-league baseball players is less than 2.6 inches. The heights (in inches) of 20 randomly selected players are shown in the table. E Click the icon to view the data table. - X Test the notion at the a = 0.05 level of significance. Data table What are the correct hypotheses for this test? The null hypothesis is H,: 2.6. V 2.6. 72 7471|73 76 76 |72 72 The alternative hypothesis is H,: |70 | 77 77 72 75 70 73 74 75 Calculate the value of the test statistic. 74 74 y2 = (Round to three decimal places as needed.) Use technology to determine the P-value for the test statistic. Print Done The P-value is (Round to three decimal places as needed.)
Data show that men between the ages of 20 and 29 in a general population have a mean height of 69.3 inches, with a standard deviation of 2.6 inches. A baseball analyst wonders whether the standard deviation of heights of major-league baseball players is less than 2.6 inches. The heights (in inches) of 20 randomly selected players are shown in the table. E Click the icon to view the data table. - X Test the notion at the a = 0.05 level of significance. Data table What are the correct hypotheses for this test? The null hypothesis is H,: 2.6. V 2.6. 72 7471|73 76 76 |72 72 The alternative hypothesis is H,: |70 | 77 77 72 75 70 73 74 75 Calculate the value of the test statistic. 74 74 y2 = (Round to three decimal places as needed.) Use technology to determine the P-value for the test statistic. Print Done The P-value is (Round to three decimal places as needed.)

Glencoe Algebra 1, Student Edition, 9780079039897, 0079039898, 2018
18th Edition
ISBN:9780079039897
Author:Carter
Publisher:Carter
Chapter10: Statistics
Section10.3: Measures Of Spread
Problem 14PPS

Related questions
Question
29
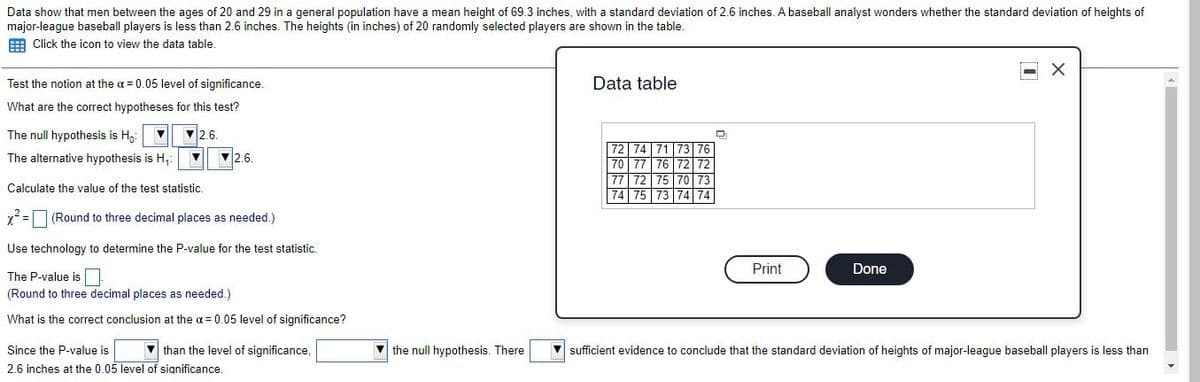
Transcribed Image Text:Data show that men between the ages of 20 and 29 in a general population have a mean height of 69.3 inches, with a standard deviation of 2.6 inches. A baseball analyst wonders whether the standard deviation of heights
major-league baseball players is less than 2.6 inches. The heights (in inches) of 20 randomly selected players are shown in the table.
E Click the icon to view the data table.
Test the notion at the a = 0.05 level of significance.
Data table
What are the correct hypotheses for this test?
The null hypothesis is H,:
2.6.
72 | 74
73
The alternative hypothesis is H,
2.6.
76
70 77
75
74 75
72
72
70
Calculate the value of the test statistic.
73 |74 74
x2 =O (Round to three decimal places as needed.)
Use technology to determine the P-value for the test statistic.
Print
Done
The P-value is|
(Round to three decimal places as needed.)
What is the correct conclusion at the a = 0.05 level of significance?
Since the P-value is
V than the level of significance,
V the null hypothesis. There
V sufficient evidence to conclude that the standard deviation of heights of major-league baseball players is less than
2.6 inches at the 0.05 level of significance.
Expert Solution
This question has been solved!
Explore an expertly crafted, step-by-step solution for a thorough understanding of key concepts.

This is a popular solution!

Trending now
This is a popular solution!

Step by step
Solved in 5 steps with 1 images

Recommended textbooks for you
Glencoe Algebra 1, Student Edition, 9780079039897…
Algebra
ISBN:
9780079039897
Author:
Carter
Publisher:
McGraw Hill

Big Ideas Math A Bridge To Success Algebra 1: Stu…
Algebra
ISBN:
9781680331141
Author:
HOUGHTON MIFFLIN HARCOURT
Publisher:
Houghton Mifflin Harcourt
Glencoe Algebra 1, Student Edition, 9780079039897…
Algebra
ISBN:
9780079039897
Author:
Carter
Publisher:
McGraw Hill
Big Ideas Math A Bridge To Success Algebra 1: Stu…
Algebra
ISBN:
9781680331141
Author:
HOUGHTON MIFFLIN HARCOURT
Publisher:
Houghton Mifflin Harcourt