Data were collected on the distance a frisbee will travel when thrown at a certain speed. The speed, s, is measured in miles per hour, and distance, y, is measured in yards. The regression line is given by y = 3.47 +47.92s. What are the slope and y-intercept of the regression line and their interpretation in the context of the problem? The slope, 3.47, indicates that the distance decreases by an average of 3.47 yards for every one mile per hour of speed. The y-intercept, 47.92, is the distance estimated by this model if the speed is one mile per hour. The slope, 47.92, indicates that the distance decreases by an average of 47.92 yards for every one mile per hour of speed. The y-intercept, 3.47, is the distance estimated by this model if the speed is one mile per hour. The slope, 47.92, indicates that the distance increases by an average of 47.92 yards for every one mile per hour of speed. The y-intercept, 3.47, is the distance estimated by this model if the speed is zero miles per hour. The slope, 3.47, indicates that the distance increases by an average of 3.47 yards for every one mile per hour of speed. The y-intercept, 47.92, is the distance estimated by this model if the speed is zero miles per hour.
Data were collected on the distance a frisbee will travel when thrown at a certain speed. The speed, s, is measured in miles per hour, and distance, y, is measured in yards. The regression line is given by y = 3.47 +47.92s. What are the slope and y-intercept of the regression line and their interpretation in the context of the problem? The slope, 3.47, indicates that the distance decreases by an average of 3.47 yards for every one mile per hour of speed. The y-intercept, 47.92, is the distance estimated by this model if the speed is one mile per hour. The slope, 47.92, indicates that the distance decreases by an average of 47.92 yards for every one mile per hour of speed. The y-intercept, 3.47, is the distance estimated by this model if the speed is one mile per hour. The slope, 47.92, indicates that the distance increases by an average of 47.92 yards for every one mile per hour of speed. The y-intercept, 3.47, is the distance estimated by this model if the speed is zero miles per hour. The slope, 3.47, indicates that the distance increases by an average of 3.47 yards for every one mile per hour of speed. The y-intercept, 47.92, is the distance estimated by this model if the speed is zero miles per hour.

Functions and Change: A Modeling Approach to College Algebra (MindTap Course List)
6th Edition
ISBN:9781337111348
Author:Bruce Crauder, Benny Evans, Alan Noell
Publisher:Bruce Crauder, Benny Evans, Alan Noell
Chapter3: Straight Lines And Linear Functions
Section3.CR: Chapter Review Exercises
Problem 15CR: Life Expectancy The following table shows the average life expectancy, in years, of a child born in...

Related questions
Question
I’m taking a statistics and probability class. Please get this correct because I want to learn. I have gotten wrong answers on here before
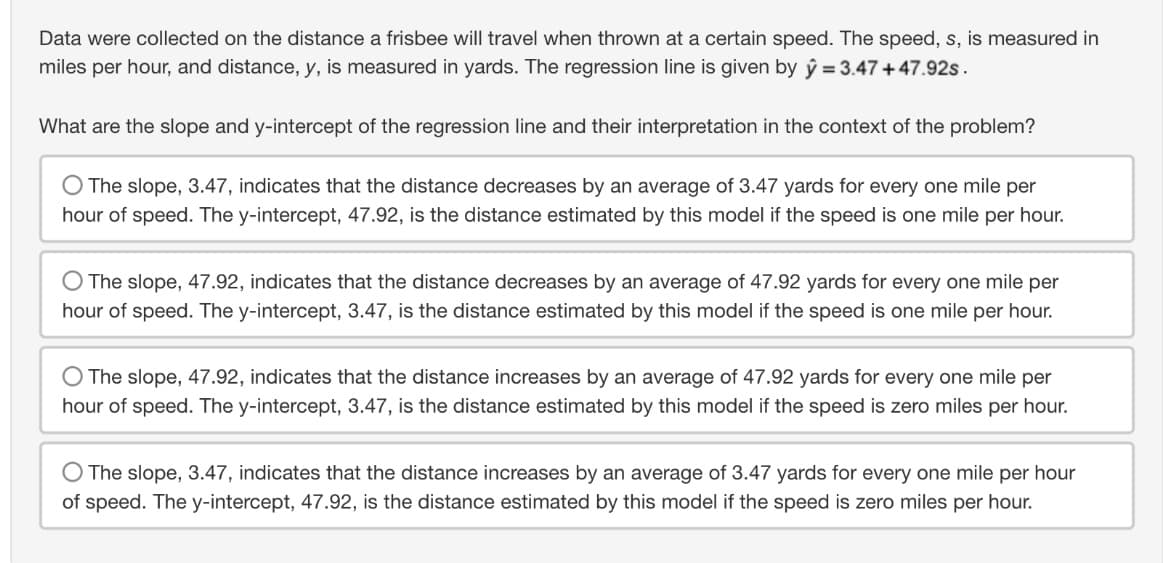
Transcribed Image Text:Data were collected on the distance a frisbee will travel when thrown at a certain speed. The speed, s, is measured in
miles per hour, and distance, y, is measured in yards. The regression line is given by y = 3.47 +47.92s.
What are the slope and y-intercept of the regression line and their interpretation in the context of the problem?
The slope, 3.47, indicates that the distance decreases by an average of 3.47 yards for every one mile per
hour of speed. The y-intercept, 47.92, is the distance estimated by this model if the speed is one mile per hour.
The slope, 47.92, indicates that the distance decreases by an average of 47.92 yards for every one mile per
hour of speed. The y-intercept, 3.47, is the distance estimated by this model if the speed is one mile per hour.
The slope, 47.92, indicates that the distance increases by an average of 47.92 yards for every one mile per
hour of speed. The y-intercept, 3.47, is the distance estimated by this model if the speed is zero miles per hour.
The slope, 3.47, indicates that the distance increases by an average of 3.47 yards for every one mile per hour
of speed. The y-intercept, 47.92, is the distance estimated by this model if the speed is zero miles per hour.
Expert Solution
This question has been solved!
Explore an expertly crafted, step-by-step solution for a thorough understanding of key concepts.

This is a popular solution!

Trending now
This is a popular solution!

Step by step
Solved in 2 steps

Recommended textbooks for you
Functions and Change: A Modeling Approach to Coll…
Algebra
ISBN:
9781337111348
Author:
Bruce Crauder, Benny Evans, Alan Noell
Publisher:
Cengage Learning


Algebra & Trigonometry with Analytic Geometry
Algebra
ISBN:
9781133382119
Author:
Swokowski
Publisher:
Cengage
Functions and Change: A Modeling Approach to Coll…
Algebra
ISBN:
9781337111348
Author:
Bruce Crauder, Benny Evans, Alan Noell
Publisher:
Cengage Learning
Algebra & Trigonometry with Analytic Geometry
Algebra
ISBN:
9781133382119
Author:
Swokowski
Publisher:
Cengage


Glencoe Algebra 1, Student Edition, 9780079039897…
Algebra
ISBN:
9780079039897
Author:
Carter
Publisher:
McGraw Hill

College Algebra (MindTap Course List)
Algebra
ISBN:
9781305652231
Author:
R. David Gustafson, Jeff Hughes
Publisher:
Cengage Learning