Date Closing Price for GOOG Monthly Return for GOOG Closing Price for NFLX Monthly Return for NFLX Closing Market Index value Monthly Market Return 2/1/2017 823.21 142.13 2278.87 3/1/2017 829.56 147.81 2363.64 4/1/2017 905.96 152.20 2362.72 5/1/2017 964.86 163.07 2384.20 6/1/2017 908.73 149.41 2411.80 7/1/2017 930.50 181.66 2423.41 8/1/2017 939.33 174.71 2470.30 9/1/2017 959.11 181.35 2471.65 10/1/2017 1016.64 196.43 2519.36 11/1/2017 1021.41 187.58 2575.26 12/1/2017 1046.40 191.96 2647.58 1/1/2018 1169.94 270.30 2673.61 2/1/2018 1104.73 291.38 2823.81 3/1/2018 1031.79 295.35 2713.83 4/1/2018 1017.33 312.46 2640.87 5/1/2018 1084.99 351.60 2648.05 6/1/2018 1115.65 391.43 2705.27 7/1/2018 1217.26 337.45 2718.37 8/1/2018 1218.19 367.68 2816.29 9/1/2018 1193.47 374.13 2901.52 10/1/2018 1076.77 301.78 2913.98 11/1/2018 1094.43 286.13 2711.74 12/1/2018 1035.61 267.66 2760.17 1/1/2019 1116.37 339.50 2506.85 2/1/2019 1119.92 358.10 2704.10 3/1/2019 1173.31 356.56 2784.49 4/1/2019 1188.48 370.54 2834.40 5/1/2019 1103.63 343.28 2945.83 6/1/2019 1080.91 367.32 2752.06 7/1/2019 1216.68 322.99 2941.76 8/1/2019 1188.10 293.75 2980.38 9/1/2019 1219.00 267.62 2926.46 10/1/2019 1260.11 287.41 2976.74 11/1/2019 1304.96 314.66 3037.56 12/1/2019 1337.02 323.57 3140.98 1/1/2020 1434.23 345.09 3230.78
Date Closing Price for GOOG Monthly Return for GOOG Closing Price for NFLX Monthly Return for NFLX Closing Market Index value Monthly Market Return 2/1/2017 823.21 142.13 2278.87 3/1/2017 829.56 147.81 2363.64 4/1/2017 905.96 152.20 2362.72 5/1/2017 964.86 163.07 2384.20 6/1/2017 908.73 149.41 2411.80 7/1/2017 930.50 181.66 2423.41 8/1/2017 939.33 174.71 2470.30 9/1/2017 959.11 181.35 2471.65 10/1/2017 1016.64 196.43 2519.36 11/1/2017 1021.41 187.58 2575.26 12/1/2017 1046.40 191.96 2647.58 1/1/2018 1169.94 270.30 2673.61 2/1/2018 1104.73 291.38 2823.81 3/1/2018 1031.79 295.35 2713.83 4/1/2018 1017.33 312.46 2640.87 5/1/2018 1084.99 351.60 2648.05 6/1/2018 1115.65 391.43 2705.27 7/1/2018 1217.26 337.45 2718.37 8/1/2018 1218.19 367.68 2816.29 9/1/2018 1193.47 374.13 2901.52 10/1/2018 1076.77 301.78 2913.98 11/1/2018 1094.43 286.13 2711.74 12/1/2018 1035.61 267.66 2760.17 1/1/2019 1116.37 339.50 2506.85 2/1/2019 1119.92 358.10 2704.10 3/1/2019 1173.31 356.56 2784.49 4/1/2019 1188.48 370.54 2834.40 5/1/2019 1103.63 343.28 2945.83 6/1/2019 1080.91 367.32 2752.06 7/1/2019 1216.68 322.99 2941.76 8/1/2019 1188.10 293.75 2980.38 9/1/2019 1219.00 267.62 2926.46 10/1/2019 1260.11 287.41 2976.74 11/1/2019 1304.96 314.66 3037.56 12/1/2019 1337.02 323.57 3140.98 1/1/2020 1434.23 345.09 3230.78
Chapter8: Analysis Of Risk And Return
Section: Chapter Questions
Problem 13QTD
Related questions
Question
use sheet 3 to complete 4 & 5 questions
| Date | Closing Market Index value | Closing Price for GOOG | Closing Price for NFLX | |||
| 2/1/2017 | 2278.87 | 823.21 | 142.13 | GOOG is Google | ||
| 3/1/2017 | 2363.64 | 829.56 | 147.81 | NFLX is Netflix | ||
| 4/1/2017 | 2362.72 | 905.96 | 152.20 | |||
| 5/1/2017 | 2384.20 | 964.86 | 163.07 | |||
| 6/1/2017 | 2411.80 | 908.73 | 149.41 | |||
| 7/1/2017 | 2423.41 | 930.50 | 181.66 | |||
| 8/1/2017 | 2470.30 | 939.33 | 174.71 | |||
| 9/1/2017 | 2471.65 | 959.11 | 181.35 | |||
| 10/1/2017 | 2519.36 | 1016.64 | 196.43 | |||
| 11/1/2017 | 2575.26 | 1021.41 | 187.58 | |||
| 12/1/2017 | 2647.58 | 1046.40 | 191.96 | |||
| 1/1/2018 | 2673.61 | 1169.94 | 270.30 | |||
| 2/1/2018 | 2823.81 | 1104.73 | 291.38 | |||
| 3/1/2018 | 2713.83 | 1031.79 | 295.35 | |||
| 4/1/2018 | 2640.87 | 1017.33 | 312.46 | |||
| 5/1/2018 | 2648.05 | 1084.99 | 351.60 | |||
| 6/1/2018 | 2705.27 | 1115.65 | 391.43 | |||
| 7/1/2018 | 2718.37 | 1217.26 | 337.45 | |||
| 8/1/2018 | 2816.29 | 1218.19 | 367.68 | |||
| 9/1/2018 | 2901.52 | 1193.47 | 374.13 | |||
| 10/1/2018 | 2913.98 | 1076.77 | 301.78 | |||
| 11/1/2018 | 2711.74 | 1094.43 | 286.13 | |||
| 12/1/2018 | 2760.17 | 1035.61 | 267.66 | |||
| 1/1/2019 | 2506.85 | 1116.37 | 339.50 | |||
| 2/1/2019 | 2704.10 | 1119.92 | 358.10 | |||
| 3/1/2019 | 2784.49 | 1173.31 | 356.56 | |||
| 4/1/2019 | 2834.40 | 1188.48 | 370.54 | |||
| 5/1/2019 | 2945.83 | 1103.63 | 343.28 | |||
| 6/1/2019 | 2752.06 | 1080.91 | 367.32 | |||
| 7/1/2019 | 2941.76 | 1216.68 | 322.99 | |||
| 8/1/2019 | 2980.38 | 1188.10 | 293.75 | |||
| 9/1/2019 | 2926.46 | 1219.00 | 267.62 | |||
| 10/1/2019 | 2976.74 | 1260.11 | 287.41 | |||
| 11/1/2019 | 3037.56 | 1304.96 | 314.66 | |||
| 12/1/2019 | 3140.98 | 1337.02 | 323.57 | |||
| 1/1/2020 | 3230.78 | 1434.23 | 345.09 |
page 4
| Date | Closing Price for GOOG | Monthly Return for GOOG | Closing Price for NFLX | Monthly Return for NFLX | Closing Market Index value | Monthly Market Return |
| 2/1/2017 | 823.21 | 142.13 | 2278.87 | |||
| 3/1/2017 | 829.56 | 147.81 | 2363.64 | |||
| 4/1/2017 | 905.96 | 152.20 | 2362.72 | |||
| 5/1/2017 | 964.86 | 163.07 | 2384.20 | |||
| 6/1/2017 | 908.73 | 149.41 | 2411.80 | |||
| 7/1/2017 | 930.50 | 181.66 | 2423.41 | |||
| 8/1/2017 | 939.33 | 174.71 | 2470.30 | |||
| 9/1/2017 | 959.11 | 181.35 | 2471.65 | |||
| 10/1/2017 | 1016.64 | 196.43 | 2519.36 | |||
| 11/1/2017 | 1021.41 | 187.58 | 2575.26 | |||
| 12/1/2017 | 1046.40 | 191.96 | 2647.58 | |||
| 1/1/2018 | 1169.94 | 270.30 | 2673.61 | |||
| 2/1/2018 | 1104.73 | 291.38 | 2823.81 | |||
| 3/1/2018 | 1031.79 | 295.35 | 2713.83 | |||
| 4/1/2018 | 1017.33 | 312.46 | 2640.87 | |||
| 5/1/2018 | 1084.99 | 351.60 | 2648.05 | |||
| 6/1/2018 | 1115.65 | 391.43 | 2705.27 | |||
| 7/1/2018 | 1217.26 | 337.45 | 2718.37 | |||
| 8/1/2018 | 1218.19 | 367.68 | 2816.29 | |||
| 9/1/2018 | 1193.47 | 374.13 | 2901.52 | |||
| 10/1/2018 | 1076.77 | 301.78 | 2913.98 | |||
| 11/1/2018 | 1094.43 | 286.13 | 2711.74 | |||
| 12/1/2018 | 1035.61 | 267.66 | 2760.17 | |||
| 1/1/2019 | 1116.37 | 339.50 | 2506.85 | |||
| 2/1/2019 | 1119.92 | 358.10 | 2704.10 | |||
| 3/1/2019 | 1173.31 | 356.56 | 2784.49 | |||
| 4/1/2019 | 1188.48 | 370.54 | 2834.40 | |||
| 5/1/2019 | 1103.63 | 343.28 | 2945.83 | |||
| 6/1/2019 | 1080.91 | 367.32 | 2752.06 | |||
| 7/1/2019 | 1216.68 | 322.99 | 2941.76 | |||
| 8/1/2019 | 1188.10 | 293.75 | 2980.38 | |||
| 9/1/2019 | 1219.00 | 267.62 | 2926.46 | |||
| 10/1/2019 | 1260.11 | 287.41 | 2976.74 | |||
| 11/1/2019 | 1304.96 | 314.66 | 3037.56 | |||
| 12/1/2019 | 1337.02 | 323.57 | 3140.98 | |||
| 1/1/2020 | 1434.23 | 345.09 | 3230.78 |

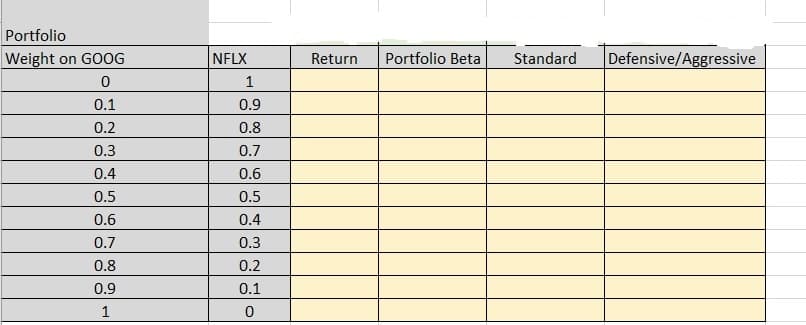
Transcribed Image Text:Portfolio
Weight on GOOG
NFLX
Return
Portfolio Beta
Standard
Defensive/Aggressive
0.1
0.9
0.2
0.8
0.3
0.7
0.4
0.6
0.5
0.5
0.6
0.4
0.7
0.3
0.8
0.2
0.9
0.1
1

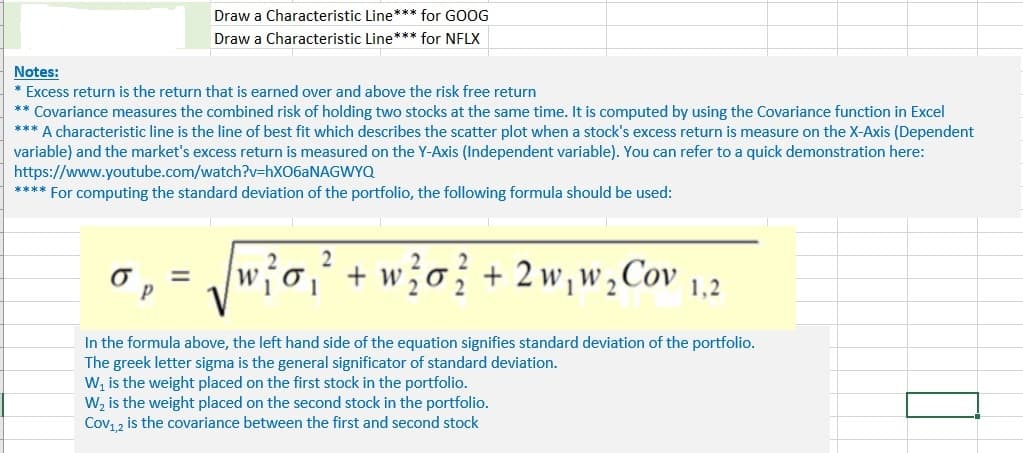
Transcribed Image Text:Draw a Characteristic Line*** for GOOG
Draw a Characteristic Line*** for NFLX
Notes:
* Excess return is the return that is earned over and above the risk free return
** Covariance measures the combined risk of holding two stocks at the same time. It is computed by using the Covariance function in Excel
*** A characteristic line is the line of best fit which describes the scatter plot when a stock's excess return is measure on the X-Axis (Dependent
variable) and the market's excess return is measured on the Y-Axis (Independent variable). You can refer to a quick demonstration here:
https://www.youtube.com/watch?v=HX06ANAGWYQ
**** For computing the standard deviation of the portfolio, the following formula should be used:
w?o,² + w?o} + 2w, w,Cov
%3D
In the formula above, the left hand side of the equation signifies standard deviation of the portfolio.
The greek letter sigma is the general significator of standard deviation.
W, is the weight placed on the first stock in the portfolio.
W, is the weight placed on the second stock in the portfolio.
Cov12 is the covariance between the first and second stock
Expert Solution
This question has been solved!
Explore an expertly crafted, step-by-step solution for a thorough understanding of key concepts.
Step by step
Solved in 5 steps with 5 images

Knowledge Booster
Learn more about
Need a deep-dive on the concept behind this application? Look no further. Learn more about this topic, finance and related others by exploring similar questions and additional content below.Recommended textbooks for you

EBK CONTEMPORARY FINANCIAL MANAGEMENT
Finance
ISBN:
9781337514835
Author:
MOYER
Publisher:
CENGAGE LEARNING - CONSIGNMENT

EBK CONTEMPORARY FINANCIAL MANAGEMENT
Finance
ISBN:
9781337514835
Author:
MOYER
Publisher:
CENGAGE LEARNING - CONSIGNMENT