Day Revenue Occupied 1 1452 32 2 1361 20 3 1426 21 4 1470 25 5 1456 26 6 1430 23 7 1354 20 8 1442 39 9 1394
Day Revenue Occupied 1 1452 32 2 1361 20 3 1426 21 4 1470 25 5 1456 26 6 1430 23 7 1354 20 8 1442 39 9 1394

Algebra for College Students
10th Edition
ISBN:9781285195780
Author:Jerome E. Kaufmann, Karen L. Schwitters
Publisher:Jerome E. Kaufmann, Karen L. Schwitters
Chapter11: Systems Of Equations
Section11.CT: Test
Problem 24CT

Related questions

Concept explainers
Contingency Table
A contingency table can be defined as the visual representation of the relationship between two or more categorical variables that can be evaluated and registered. It is a categorical version of the scatterplot, which is used to investigate the linear relationship between two variables. A contingency table is indeed a type of frequency distribution table that displays two variables at the same time.
Binomial Distribution
Binomial is an algebraic expression of the sum or the difference of two terms. Before knowing about binomial distribution, we must know about the binomial theorem.
Topic Video
Question
| Day | Revenue | Occupied |
| 1 | 1452 | 32 |
| 2 | 1361 | 20 |
| 3 | 1426 | 21 |
| 4 | 1470 | 25 |
| 5 | 1456 | 26 |
| 6 | 1430 | 23 |
| 7 | 1354 | 20 |
| 8 | 1442 | 39 |
| 9 | 1394 | 15 |
| 10 | 1459 | 50 |
| 11 | 1399 | 41 |
| 12 | 1458 | 35 |
| 13 | 1537 | 41 |
| 14 | 1425 | 31 |
| 15 | 1445 | 51 |
| 16 | 1439 | 62 |
| 17 | 1348 | 45 |
| 18 | 1450 | 41 |
| 19 | 1431 | 62 |
| 20 | 1446 | 47 |
| 21 | 1485 | 43 |
| 22 | 1405 | 38 |
| 23 | 1461 | 36 |
| 24 | 1490 | 60 |
| 25 | 1426 | 65 |
Transcribed Image Text:BUSU610ExcelAssignment#7 (2) - Excel
P Search
À Gregg Fells
AutoSave
ff
File
Home
Insert
Page Layout
Formulas
Data
Review
View
Help
8 Share
P Comments
M Ruler
V Formula Bar
E Split
CD View Side by Side
A
Default
100
ZHide
| Hide
Normal Page Break Page Custom
Preview Layout Views
New Arrange Freeze
Panes v O
D[ Synchronous Scrolling
|Unhide m Reset Window Position
Zoom 100% Zoom to
Switch
Macros
H Keep e Exit New E Options
V Gridlines v Headings
Selection
Window
All
Windows
Sheet View
Workbook Views
Show
Zoom
Window
Маcros
C26
fe
65
F
G
H
J
K
L
M
N
Q
R
1
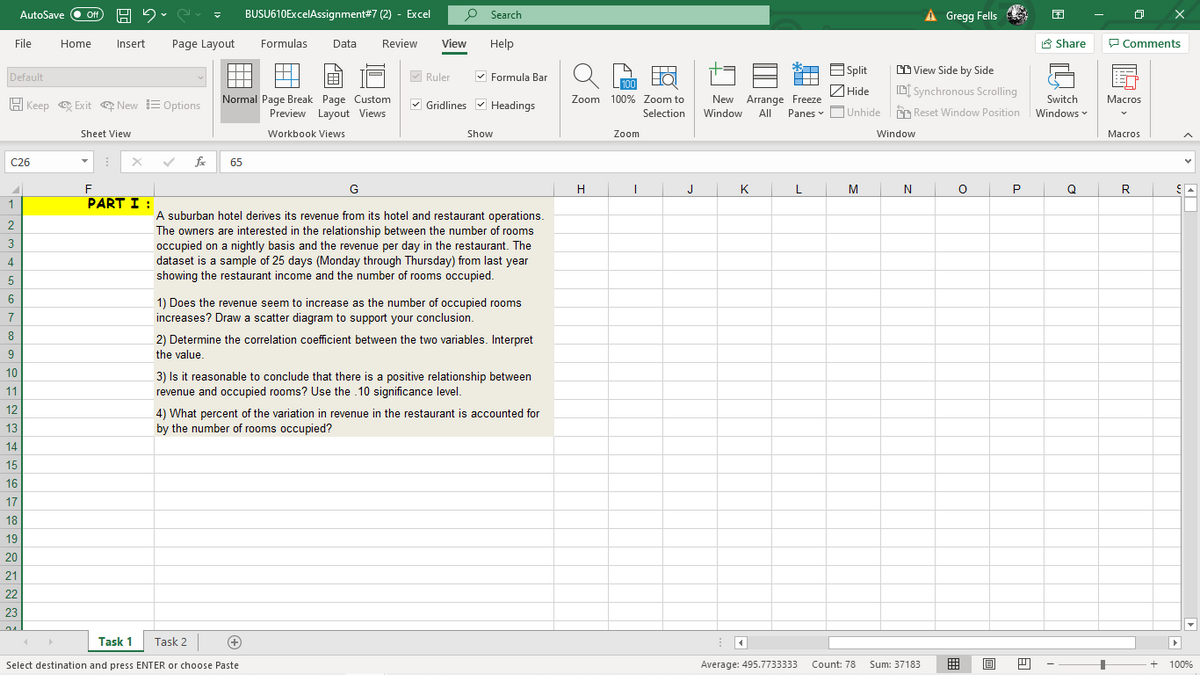
PART I :
A suburban hotel derives its revenue from its hotel and restaurant operations.
The owners are interested in the relationship between the number of rooms
occupied on a nightly basis and the revenue per day in the restaurant. The
dataset is a sample of 25 days (Monday through Thursday) from last year
showing the restaurant income and the number of rooms occupied.
3
4
5
6
1) Does the revenue seem to increase as the number of occupied rooms
7
increases? Draw a scatter diagram to support your conclusion.
8
2) Determine the correlation coefficient between the two variables. Interpret
9
the value.
10
3) Is it reasonable to conclude that there is a positive relationship between
revenue and occupied rooms? Use the .10 significance level.
11
12
4) What percent of the variation in revenue in the restaurant is accounted for
13
by the number of rooms occupied?
14
15
16
17
18
19
20
21
22
23
Task 1
Task 2
Select destination and press ENTER or choose Paste
Average: 495.7733333
Count: 78
Sum: 37183
囲
100%
白
Expert Solution
This question has been solved!
Explore an expertly crafted, step-by-step solution for a thorough understanding of key concepts.

Step by step
Solved in 2 steps with 2 images

Knowledge Booster


Learn more about
Need a deep-dive on the concept behind this application? Look no further. Learn more about this topic, statistics and related others by exploring similar questions and additional content below.Recommended textbooks for you
Algebra for College Students
Algebra
ISBN:
9781285195780
Author:
Jerome E. Kaufmann, Karen L. Schwitters
Publisher:
Cengage Learning
Algebra for College Students
Algebra
ISBN:
9781285195780
Author:
Jerome E. Kaufmann, Karen L. Schwitters
Publisher:
Cengage Learning