Degree of Injuny Seurity Measures no precaution Seat belt only (s) seat bolt and air bag (2) sturdy (o) 0,0 6 0,07 0,07 slightly injured (I) 0,48 0115 0111 badly woun ded (2) O,06 0110 death (3) 0,01


Contingency Table
A contingency table can be defined as the visual representation of the relationship between two or more categorical variables that can be evaluated and registered. It is a categorical version of the scatterplot, which is used to investigate the linear relationship between two variables. A contingency table is indeed a type of frequency distribution table that displays two variables at the same time.
Binomial Distribution
Binomial is an algebraic expression of the sum or the difference of two terms. Before knowing about binomial distribution, we must know about the binomial theorem.
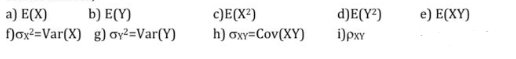
In a research , a probability distribution was obtained between the risk of injury in traffic accidents and the use of seat belts and airbags as follows.
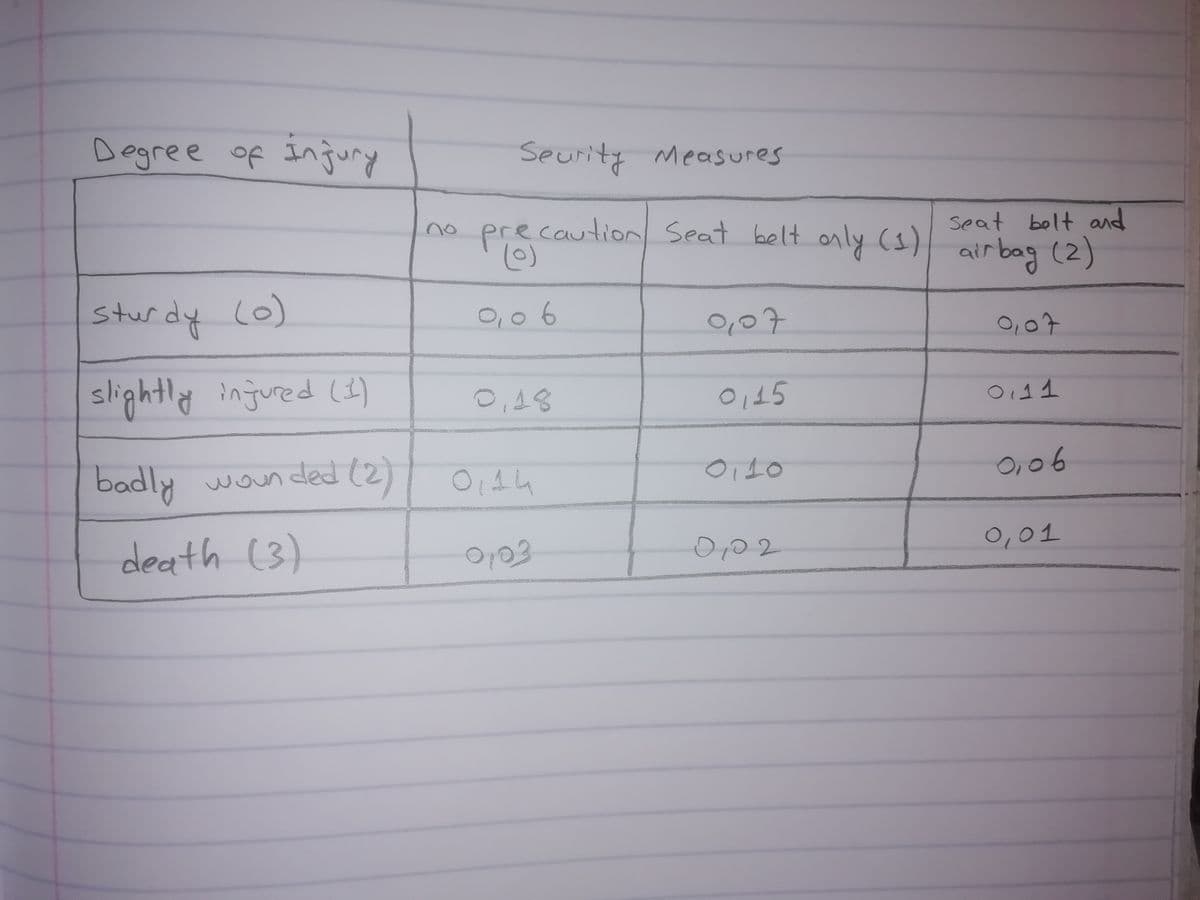
If the degree of injury is taken as the Y random variable and the security precaution as the X random variable; Calculate the options a, b, c, d, e, f, g, h, i .

Step by step
Solved in 2 steps with 1 images


