Demand and supply of umbrellas QUESTION 2 Sludy the graph below and answer the questions that follow: 120 100 80 60 40 20 10 11 7. 8. Name the vertical/y-axis. (2) 2.1 2.2 Name the horizontal /x-axis. (2) 2.3 How many umbrelas are consumers willing to buy at a price of R70? (2)
Demand and supply of umbrellas QUESTION 2 Sludy the graph below and answer the questions that follow: 120 100 80 60 40 20 10 11 7. 8. Name the vertical/y-axis. (2) 2.1 2.2 Name the horizontal /x-axis. (2) 2.3 How many umbrelas are consumers willing to buy at a price of R70? (2)

Principles of Macroeconomics (MindTap Course List)
8th Edition
ISBN:9781305971509
Author:N. Gregory Mankiw
Publisher:N. Gregory Mankiw
Chapter7: Consumers, Producers, And The Efficiency Of Markets
Section: Chapter Questions
Problem 7PA

Related questions
Question
100%
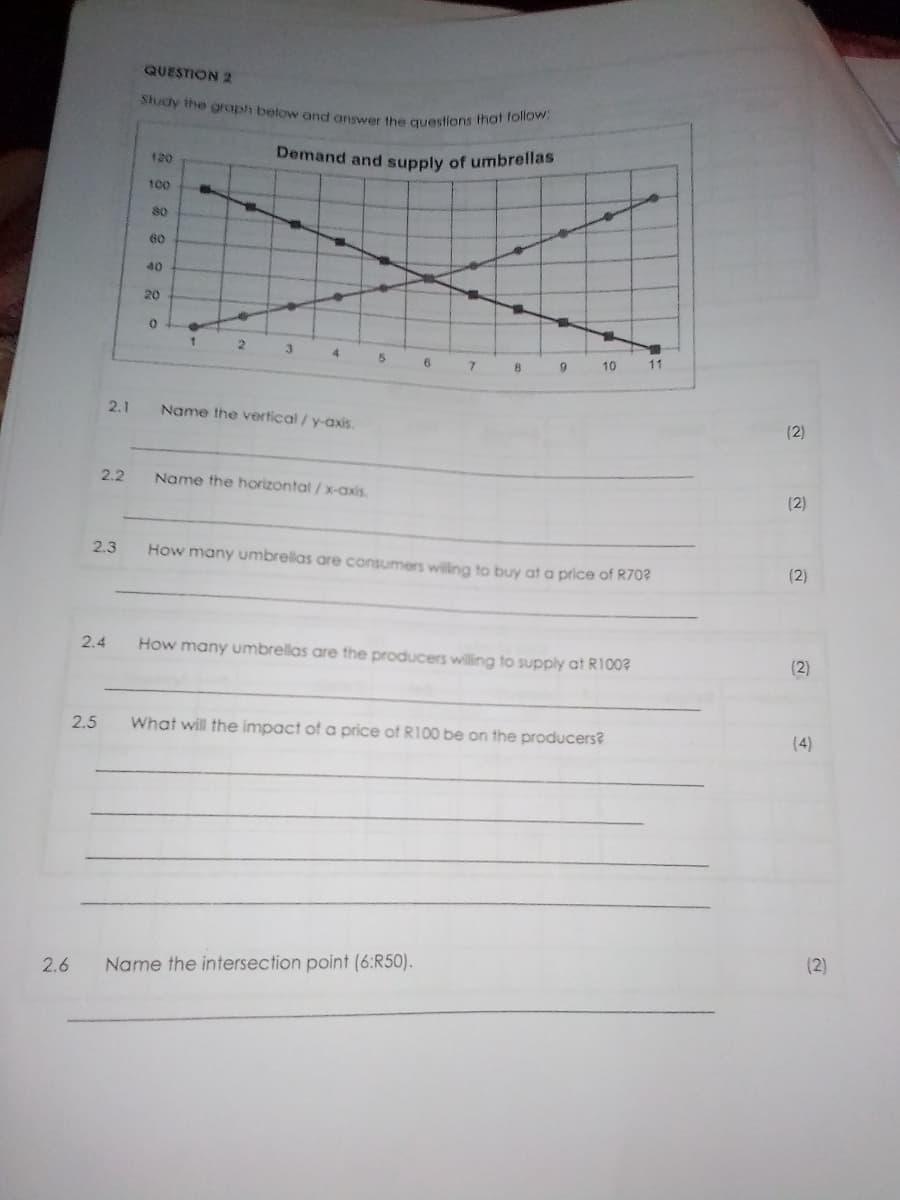
Transcribed Image Text:Demand and supply of umbrellas
Sludy the graph below and answer the questions that tollow:
QUESTION 2
120
100
80
60
40
20
3
4.
11
7.
8
10
2.1
Name the vertical/y-axis.
(2)
2.2
Name the horizontal / x-axis
(2)
2.3
How many umbrelas are consumers willing to buy at a price of R70?
(2)
2.4
How many umbrellas are the producers willing to supply at R100?
(2)
2.5
What will the impact of a price of R100 be on the producers?
(4)
(2)
2.6
Name the intersection point (6:R50).
Expert Solution
This question has been solved!
Explore an expertly crafted, step-by-step solution for a thorough understanding of key concepts.

This is a popular solution!

Trending now
This is a popular solution!

Step by step
Solved in 2 steps

Recommended textbooks for you
Principles of Macroeconomics (MindTap Course List)
Economics
ISBN:
9781305971509
Author:
N. Gregory Mankiw
Publisher:
Cengage Learning

Principles of Economics (MindTap Course List)
Economics
ISBN:
9781305585126
Author:
N. Gregory Mankiw
Publisher:
Cengage Learning

Principles of Microeconomics (MindTap Course List)
Economics
ISBN:
9781305971493
Author:
N. Gregory Mankiw
Publisher:
Cengage Learning
Principles of Macroeconomics (MindTap Course List)
Economics
ISBN:
9781305971509
Author:
N. Gregory Mankiw
Publisher:
Cengage Learning
Principles of Economics (MindTap Course List)
Economics
ISBN:
9781305585126
Author:
N. Gregory Mankiw
Publisher:
Cengage Learning
Principles of Microeconomics (MindTap Course List)
Economics
ISBN:
9781305971493
Author:
N. Gregory Mankiw
Publisher:
Cengage Learning

Principles of Macroeconomics (MindTap Course List)
Economics
ISBN:
9781285165912
Author:
N. Gregory Mankiw
Publisher:
Cengage Learning

Essentials of Economics (MindTap Course List)
Economics
ISBN:
9781337091992
Author:
N. Gregory Mankiw
Publisher:
Cengage Learning

Principles of Economics, 7th Edition (MindTap Cou…
Economics
ISBN:
9781285165875
Author:
N. Gregory Mankiw
Publisher:
Cengage Learning