Demand for oil changes at Garcia's Garage has been as follows: Month January February March April May June 58 July August 54 Use simple linear regression analysis to develop a forecasting model for monthly demand. In this application, the dependent variable, Y. is monthly demand and the independent variable, X is the month. For January, let X-1; for February, let X-2; and so on. The forecasting model is given by the equation Y=x (Enter your responses rounded to two decimal places) Number of Oil Changes 34 50 60 45 53 18893882
Demand for oil changes at Garcia's Garage has been as follows: Month January February March April May June 58 July August 54 Use simple linear regression analysis to develop a forecasting model for monthly demand. In this application, the dependent variable, Y. is monthly demand and the independent variable, X is the month. For January, let X-1; for February, let X-2; and so on. The forecasting model is given by the equation Y=x (Enter your responses rounded to two decimal places) Number of Oil Changes 34 50 60 45 53 18893882

Algebra & Trigonometry with Analytic Geometry
13th Edition
ISBN:9781133382119
Author:Swokowski
Publisher:Swokowski
Chapter7: Analytic Trigonometry
Section7.6: The Inverse Trigonometric Functions
Problem 91E

Related questions
Question
D4
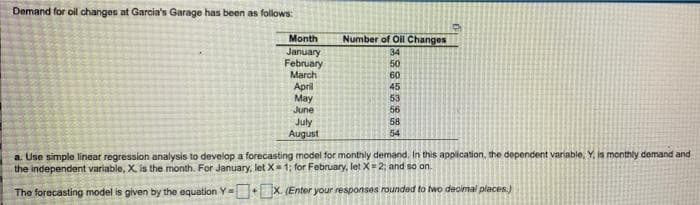
Transcribed Image Text:Demand for oil changes at Garcia's Garage has been as follows:
Month
January
February
March
April
May
June
58
July
August
54
a. Use simple linear regression analysis to develop a forecasting model for monthly demand. In this application, the dependent variable, Y. is monthly demand and
the independent variable, X. is the month. For January, let X-1; for February, let X=2; and so on.
The forecasting model is given by the equation Y=+x. (Enter your responses rounded to two decimal places)
Number of Oil Changes
34
50
38892883
60
45
53
56
Expert Solution
This question has been solved!
Explore an expertly crafted, step-by-step solution for a thorough understanding of key concepts.

Step by step
Solved in 3 steps with 2 images

Recommended textbooks for you
Algebra & Trigonometry with Analytic Geometry
Algebra
ISBN:
9781133382119
Author:
Swokowski
Publisher:
Cengage

College Algebra
Algebra
ISBN:
9781305115545
Author:
James Stewart, Lothar Redlin, Saleem Watson
Publisher:
Cengage Learning

Algebra and Trigonometry (MindTap Course List)
Algebra
ISBN:
9781305071742
Author:
James Stewart, Lothar Redlin, Saleem Watson
Publisher:
Cengage Learning
Algebra & Trigonometry with Analytic Geometry
Algebra
ISBN:
9781133382119
Author:
Swokowski
Publisher:
Cengage
College Algebra
Algebra
ISBN:
9781305115545
Author:
James Stewart, Lothar Redlin, Saleem Watson
Publisher:
Cengage Learning
Algebra and Trigonometry (MindTap Course List)
Algebra
ISBN:
9781305071742
Author:
James Stewart, Lothar Redlin, Saleem Watson
Publisher:
Cengage Learning

Functions and Change: A Modeling Approach to Coll…
Algebra
ISBN:
9781337111348
Author:
Bruce Crauder, Benny Evans, Alan Noell
Publisher:
Cengage Learning