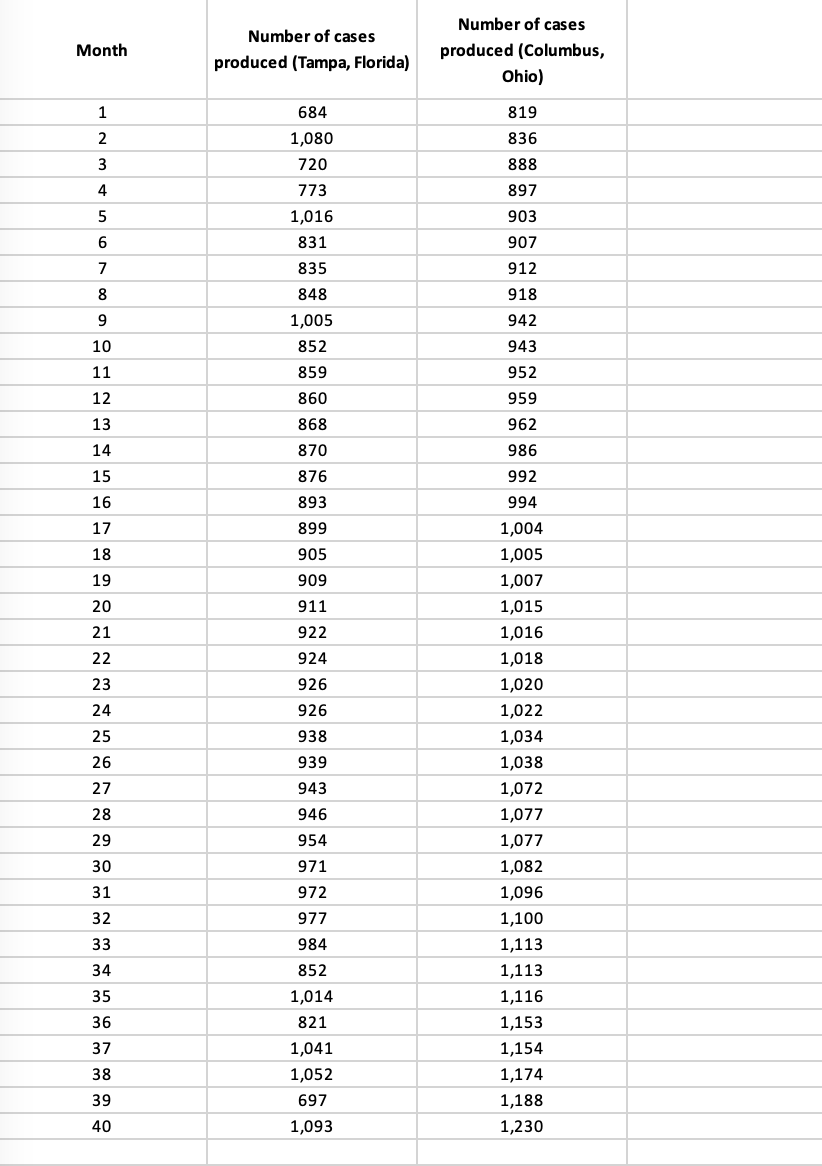
Demonstrate a Frequency Distribution Table for Tampa, Florida, and Columbus, Ohio. Please show work from excel.


Q: A probability based on equally likely outcomes is called a __________ probability.
A:
Q: calculate all of the measures of variation that are appropriate.
A: Here measures of variation IQR Range Variance Standard deviation
Q: 1) Estimate the population mean of the number of customers entering the restaurant each day.
A: Here use formula of Mean, variance, median And here ascending order of data 18,19,20,25,31,42
Q: A die is rolled twice. What is the probability of showing a 5 on the first roll and an even number o...
A:
Q: 8. Suppose Jack has 1 red ball, 1 orange ball, 1 blue ball, 1 yellow ball, 1 black ball and 1 green ...
A: Given that Jack has Red ball = 1 Orange ball = 1 Blue ball = 1 yellow ball = 1 black ball = 1 Gre...
Q: 4. A Warranty data for an automobile component is shown below: # failures # of Censored # vehicles M...
A: @solution:::
Q: (a) Of all people in the United States who have type B blood, what percent are Rh positive? (Round t...
A: Given: Blood type O+ O- A+ A- B+ B- AB+ AB- Occurrence 36 7 34 6 11 2 3 1
Q: A company producing LED bulbs finds that mean life span of the population of its bulbs is 2000 hours...
A:
Q: Fred and Ted are interested in the average height of NC State students. They randomly sample student...
A: Given that Fred sample size (n) = 121 Ted sample size (n) = 144 We know that Margin of error (...
Q: A two tail test is used only (choose one) (i) to minimize the possibility of making of making a ...
A: If the direction of the alternative hypothesis is "not equal to", then it is called two-tailed test.
Q: My internal width is 8, how can i solve for the class intervals? and please do solve this problem wi...
A: Number of times a variate value is repeated is called its frequency. The number of observations corr...
Q: In a certain country the heights of adult men are normally distributed with a mean of 68.9 inches an...
A:
Q: Create a probability model on the number of items that may be true.
A: Here use binomial distribution because Finite number of trial (n=5) There are two outcomes success...
Q: Describe the shape, center, and spread of this distribution.
A: The Mean is Mean =∑i=1nxin=56.0216=3.5012 The median is Median=value of (n2) observation +value ...
Q: A. The scores of students in the midyear examination for Mathematics has a mean of 32 and a standard...
A: Given that Mean = 32, SD = 5 Find the Z-scores for 1. x = 37 2. x = 22 3. x = 33 4. x = 28 5. x = 30
Q: 1. A training director of a large chain of department stores in Makati wants to know if a week's tra...
A: The following data of 10 salesladies are given before and after the training as: Before After 6...
Q: Assume that a randomly selected subject is given a bone density test. Those test scores are normally...
A:
Q: Miss Piggy, trying to prove that she is not just a pretty face, urged all of the Muppets to apply to...
A: Hai
Q: Calculate the 95% confidence limit.
A: here sample size is small and population standard deviation also unknown so use t critical for conf...
Q: Theorem 5-6. (a) If X and Y are independent continuous r.v.'s, then the p.d.f. of U = X + Y is given...
A:
Q: The results of an analysis for a certain sample are given (in ppm): 20.1, 24.1, 23.5, 22.2, and 21.6...
A: Given data is20.1,24.1,23.5,22.2,21.6
Q: Dandelions are studied for their effects on crop production and lawn growth. In one region, the mean...
A: Since the probability for the given variable (that is discrete in nature), i.e., the probability of ...
Q: The probability that a contractor will get a plumbing contract, is 2/3 and the probability that he w...
A: Let P=a contractor will get a plumbing contractE=a contractor will get an electric contractGiven,P(P...
Q: Assume that the length of human pregnancies from conception to birth varies according to a distribut...
A:
Q: The height of the rose plants in a garden is Normally distributed with a mean 100cms. Given that 10%...
A:
Q: (a) Given bxy= 0.85, byx= 0.89 and the standard deviation of X 6, find the value of 'r' and oy. (b) ...
A:
Q: Calculate the median and mode (by grouping method) from the following data: Central size : 15 25 35 ...
A:
Q: Claire flips a coin 4 times. Using the table, what is the probability that the coin will show tails ...
A: We use the given probability distribution table to find the required probability.
Q: When a die is thrown X denotes the number turns up. Find E(X), E(X²) and Var(X).
A:
Q: C. A random variable X has the probability distribution as follows: 0. 1 3 4 P(x) 0.06 0.23 0.35 0.0...
A: As per Bartleby guideline expert have to answer first question only dear student here I have done pa...
Q: A normal distribution has a mean of 80 and a standard deviation of 6. Find the z-score for a data va...
A:
Q: Performance of students of X Standard in a national level talent search examination was studied. The...
A: The z test are used to measure the mean significance between the sample and population. If the sampl...
Q: here a sample of a depression inventory 58,47,52, 61,59,56,49 ...
A:
Q: Problem 6 The average travel time (one way) from National University to Robinsons Magnolia is 25 min...
A:
Q: Calculate the median and mode (by grouping method) from the following data: Central size : 15 25 35 ...
A:
Q: Use this information to answer #19 - #23: A sample of 10 Psychology students at UNCP students were a...
A:
Q: At a drug rehab center 34% experience depression and 29% experience weight gain. 16% experience both...
A: As per guidelines expert have to answer first question three subparts only dear student please uploa...
Q: Find the variance for the given data. Round your answer to one more decimal place than the original ...
A:
Q: Hand in: Refer to Example C pg 117 (Rice). Show that E-0 xp(x) = 1 if X~Poi(1). Expand the steps. %3...
A: We have to Find the expected value of X for Poisson distribution
Q: Need help answering A, B and C. B) Perform the linear regression calculation and provide the linear...
A: A. Y: Number of air conditioning units sold X: outside temperature (Degrees F). Scatter Diagram: Ste...
Q: 4. There is a significant difference between the proportion of male and the proportion of female emp...
A: Since you have asked multiple questions, we will solve the first question for you. If you want any s...
Q: A pizza place has pizzas in 2 different sizes, with 6 different flavors for the crust, and 10 differ...
A:
Q: Data set: 13,7,7,15,10,9,12 1. Compute the following: (SHOW YOUR SOLUTION) N Σαι-5 (X i – 5) Σχ2 (EX...
A: Given data set is 13,7,7,15,10,9,12
Q: The mean price of houses in a city is $1.5 million with a standard deviation of $500,000. The house ...
A:
Q: For a large sporting event the broadcasters sold 66 ad slots for a total revenue of $160 million. Wh...
A: According to the given information, we have Given that for a large sporting event the broadcasters s...
Q: Theorem 5.6 (d) Distribution of the Quotient of Two Random Variables. If X and Y are independent con...
A:
Q: Jenelle draws one from a standard deck of 52 cards. a) Determine the probability of drawing either ...
A: a) In a standard deck of playing cards there are total 52 cards and 4 suits, such as hearts, diamond...
Q: Let X be a discrete random variable with the following probability distribution -3 6 P(X=x) Find mea...
A:
Q: Height of the fathers and sons are given below. Find the height or tne son when the neight of father...
A:
Q: 2.44 Cat weights: The histogram shown below represents the weights (in kg) of 47 female and 97 male ...
A:
Demonstrate a Frequency Distribution Table for Tampa, Florida, and Columbus, Ohio. Please show work from excel.


Trending now
This is a popular solution!

Step by step
Solved in 2 steps

- A researcher wanted to know if an individual’s reaction of the election was impacted by their political party and religious beliefs. Test to see if religious belief and political affiliation affects election reaction. Democrat Republican Independent Religious 10140714ΣX2 = 541 1117181816ΣX2 = 1314 2121121723ΣX2 = 1844 Non Religious 211310174ΣX2 = 1015 2420251825ΣX2 = 2550 2228292822ΣX2 = 3377A computer used by a 24-hour banking service is supposed to randomly assign each transaction to one of 5 memory locations. A check at the end of a day's transactions gave the counts shown in the table to each of the 5 memory locations, along with the number of reported errors. Memory Location: 1 2 3 4 5 Number of Transactions: 82 100 74 92 102 Number of Reported Errors 11 12 6 9 10 The bank manager wanted to test whether the proportion of errors in transactions assigned to each of the 5 memory locations differ. Which test would be used to properly analyze the data in this experiment? χ2 test for difference among more than two proportions χ2 test of independence McNemar test for the difference among more than two proportions McNemar test for the difference between two proportionsA random survey of enrollment at 10 community colleges across the United States yielded the following figures: 2523; 1707; 5420; 2835; 1129; 5452; 2360; 1448; 2958; and 4110. What is the 99% Error Bound (EBM) of the population mean?
- A random sample of stipends for teaching assistants in economics is listed. Is there sufficientevidence at a = 0.0 level to conclude that the average stipend greater than $15,000?S14.000 $18,000 $12,000 $14,356 $13,185 $13,419 $14.000 $11,981 $17,604 $12,283 $16,338 $15.000To assess the effect of piston ring type and oil type on piston ring wear, three types of piston ring and four types of oil were studied. Three replications of an experiment, in which the number of milligrams of material lost from the ring in four hours of running was measured, were carried out for each of the 12 combinations of oil type and piston ring type. With oil type as the row effect and piston ring type as the column effect, the following sums of squares were observed: SSA = 1.0926, SSB = 0.9340, SSAB = 0.2485, SSE = 1.7034. a) How many degrees of freedom are there for the effect of oil type? b) How many degrees of freedom are there for the effect of piston ring type? c) How many degrees of freedom are there for interactions? d) How many degrees of freedom are there for error? e) Construct an ANOVA table. You may give ranges for the P-values. f) Is the additive model plausible? Provide the value of the test statistic and the P-value. g) Is it plausible that the main effects of…The residents of a housing development for senior citizens have completed a survey whereon they indicated how physically active they are and how many visitors they receive each week. Are these two varibles related for the 10 cases reported below?
- A random sample of stipends of teaching assistants in economics is listed. Is there sufficient evidence at the =α0.05 level to conclude that the average stipend differs from $15,000? The stipends listed (in dollars) are for the academic year. Assume that the population is approximately normally distributed. 12,283 13,185 13,419 14,356 12,000 17,604 11,981 14,000 14,000The tar content in samples of cigar tobacco follows:1.542 1.585 1.532 1.466 1.499 1.6111.622 1.466 1.546 1.494 1.548 1.6261.44 1.608 1.52 1.478 1.542 1.5111.459 1.533 1.532 1.523 1.397 1.4871.598 1.498 1.6 1.504 1.545 1.5581.555 1.712 1.442 1.443 1.699 1.7011.698 1.88 1.11 1.21 1.987 1.39Find the 99% CI on the mean tar content.A research center claims that 30% of adults in a certain country would travel into space on a commercial flight if they could afford it. In a random sample of 700 adults in that country, 34% say that they would travel into space on a commercial flight if they could afford it. At α=0.01, is there enough evidence to reject the research center's claim? Complete parts (a) through (d) below.
- Fifteen fourth-grade students were randomly assigned to three groups to experiment with three different methods of teaching arithmetic. At the end of the semester, the same test was given to all 15 students. The table gives the scores of students in the three groups. Method I Method II Method III 48 55 84 73 85 68 51 70 95 65 69 74 87 90 67 CALCULATE the value of the test statistic FA sample of 12 male and 12 female students were surveyed and the amount spent on food last week were recorded. The results are summarized in the table below. Test for the hypothesis that the weekly amount spent on food of male and female students is the same, at a=0.10. Male Female 623 685 537 629 613 517 588 580 651 658 688 582 526 614 579 528 814 655 878 804 660 549 722 617 a. What are the null and alternative hypotheses?b. What is the critical value? (4 decimal points)c. What is the test statistic? (4 decimal points)e. Reject or accept null hypothesis?Regarding the test of significance for the usefulness of the predictor variables x1, x2, and x3 in predicting y, which of the three sums of squares gures in its calculation?