Demonstrate your comprehension of differences in changes in supply versus changes in quantity supplied by matching choices. shown graphically as a rightward shift in a supply curve caused by a decrease in the price of the good or service 1. increase in supply caused by an increase in the price of the good or service 2. increase in quantity supplied shown graphically as a leftward shift in a supply 3. decrease in supply curve 4. decrease in quantity supplied shown graphically as movement up along a supply curve shown graphically as movement down along a supply curve
Demonstrate your comprehension of differences in changes in supply versus changes in quantity supplied by matching choices. shown graphically as a rightward shift in a supply curve caused by a decrease in the price of the good or service 1. increase in supply caused by an increase in the price of the good or service 2. increase in quantity supplied shown graphically as a leftward shift in a supply 3. decrease in supply curve 4. decrease in quantity supplied shown graphically as movement up along a supply curve shown graphically as movement down along a supply curve

Principles of Economics 2e
2nd Edition
ISBN:9781947172364
Author:Steven A. Greenlaw; David Shapiro
Publisher:Steven A. Greenlaw; David Shapiro
Chapter6: Consumer Choices
Section: Chapter Questions
Problem 11RQ: As a general rule, is it safe to assume that a change in the price of a good will always have its...

Related questions
Question
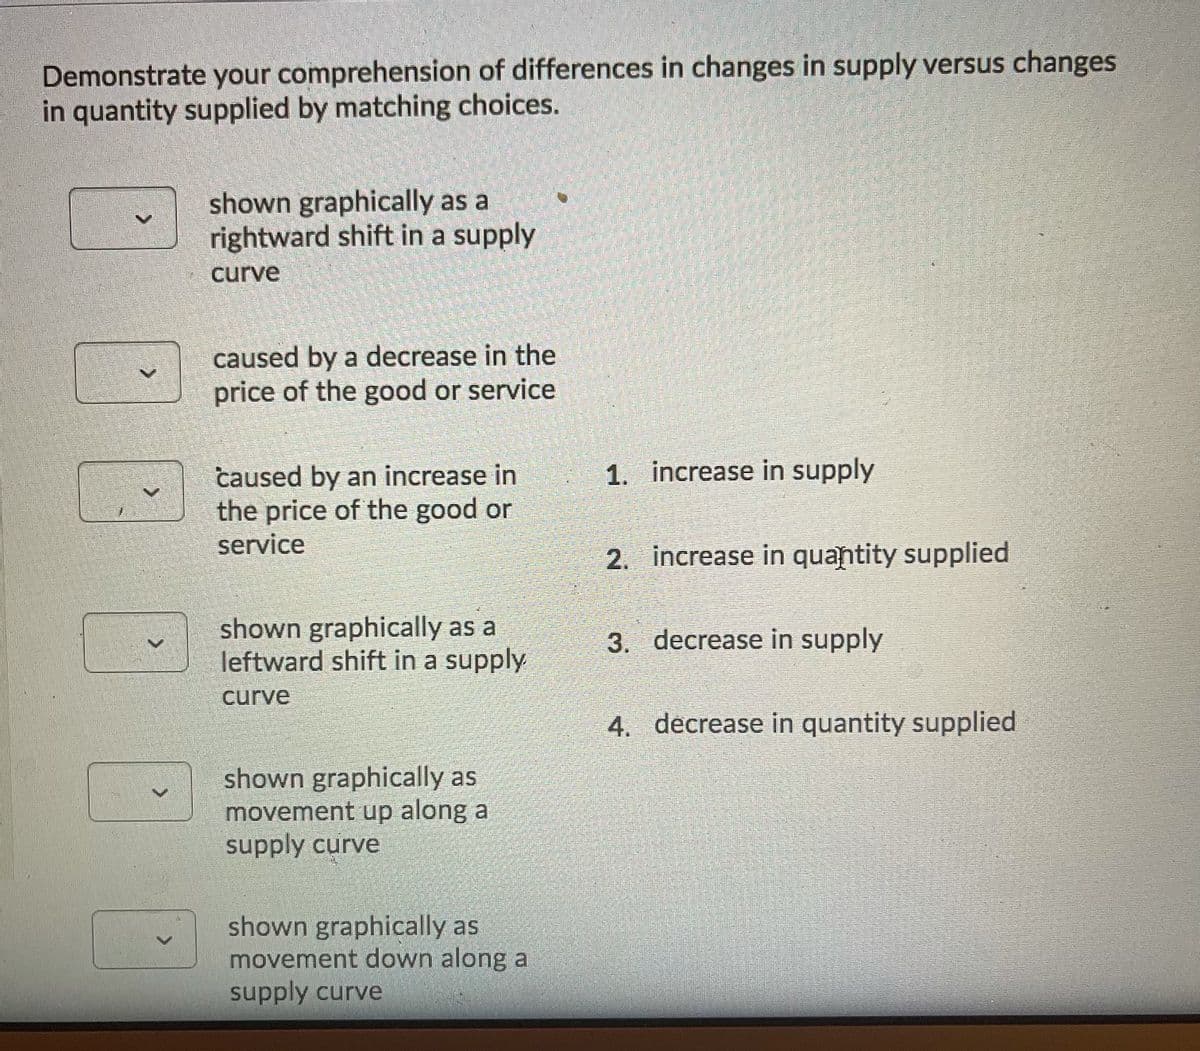
Transcribed Image Text:Demonstrate your comprehension of differences in changes in supply versus changes
in quantity supplied by matching choices.
shown graphically as a
rightward shift in a supply
curve
caused by a decrease in the
price of the good or service
1. increase in supply
caused by an increase in
the price of the good or
service
2. increase in quantity supplied
shown graphically as a
leftward shift in a supply
3. decrease in supply
curve
4. decrease in quantity supplied
shown graphically as
movement up along a
supply curve
shown graphically as
movement down along a
supply curve
Expert Solution
This question has been solved!
Explore an expertly crafted, step-by-step solution for a thorough understanding of key concepts.

This is a popular solution!

Trending now
This is a popular solution!

Step by step
Solved in 2 steps

Follow-up Questions
Read through expert solutions to related follow-up questions below.
Follow-up Question
![A- How Markets Work: Supply & Demand, and Equilibrium (P
Time Taken:0:30:56
Jaylla Braggs: Attempt 2
%
f5
5
Listen
Demonstrate your comprehension of differences in changes in demand versus
changes in quantity demanded by matching choices.
T
16
>
6
>
Y
increase in the price of
orange juice
decrease in the price of
orange juice
increase in the supply of
orange juice
increase in price of
grapefruit juice
increase in the price of
f7
&
7
U
f8
04
8
1
fg
hp
K◄◄
(
9
199+
1. change in demand for orange juice
change in quantity demanded for
orange juice
2.
3.
f10
O
neither; does not represent change
in demand or change in quantity
demanded
O
▶I
O
E
f11
GO
P
f12
{
+
C
ins
prt sc
Raining now
]
delete
← backspac](https://content.bartleby.com/qna-images/question/459b36ec-37b9-4aa6-9fa9-523b28d6a823/70017d78-21b1-46dc-b444-e7a4f5d202a4/y81k1ws_processed.jpeg)
Transcribed Image Text:A- How Markets Work: Supply & Demand, and Equilibrium (P
Time Taken:0:30:56
Jaylla Braggs: Attempt 2
%
f5
5
Listen
Demonstrate your comprehension of differences in changes in demand versus
changes in quantity demanded by matching choices.
T
16
>
6
>
Y
increase in the price of
orange juice
decrease in the price of
orange juice
increase in the supply of
orange juice
increase in price of
grapefruit juice
increase in the price of
f7
&
7
U
f8
04
8
1
fg
hp
K◄◄
(
9
199+
1. change in demand for orange juice
change in quantity demanded for
orange juice
2.
3.
f10
O
neither; does not represent change
in demand or change in quantity
demanded
O
▶I
O
E
f11
GO
P
f12
{
+
C
ins
prt sc
Raining now
]
delete
← backspac
Solution
Knowledge Booster


Learn more about
Need a deep-dive on the concept behind this application? Look no further. Learn more about this topic, economics and related others by exploring similar questions and additional content below.Recommended textbooks for you
Principles of Economics 2e
Economics
ISBN:
9781947172364
Author:
Steven A. Greenlaw; David Shapiro
Publisher:
OpenStax
Principles of Economics 2e
Economics
ISBN:
9781947172364
Author:
Steven A. Greenlaw; David Shapiro
Publisher:
OpenStax