dent-resources/sta-296-datasets. hus Cancer 81 461 20 450 246 166 63 64 155 859 151 166 37 223 138 72 245 Colon Cancer 248 377 189 1,843 180 537 519 455 406 365 942 776 372 163 101 20 283 Ovarian C 1,23 89 201 356 2,97 456
dent-resources/sta-296-datasets. hus Cancer 81 461 20 450 246 166 63 64 155 859 151 166 37 223 138 72 245 Colon Cancer 248 377 189 1,843 180 537 519 455 406 365 942 776 372 163 101 20 283 Ovarian C 1,23 89 201 356 2,97 456

Glencoe Algebra 1, Student Edition, 9780079039897, 0079039898, 2018
18th Edition
ISBN:9780079039897
Author:Carter
Publisher:Carter
Chapter10: Statistics
Section10.6: Summarizing Categorical Data
Problem 23PPS

Related questions
Question
5.11
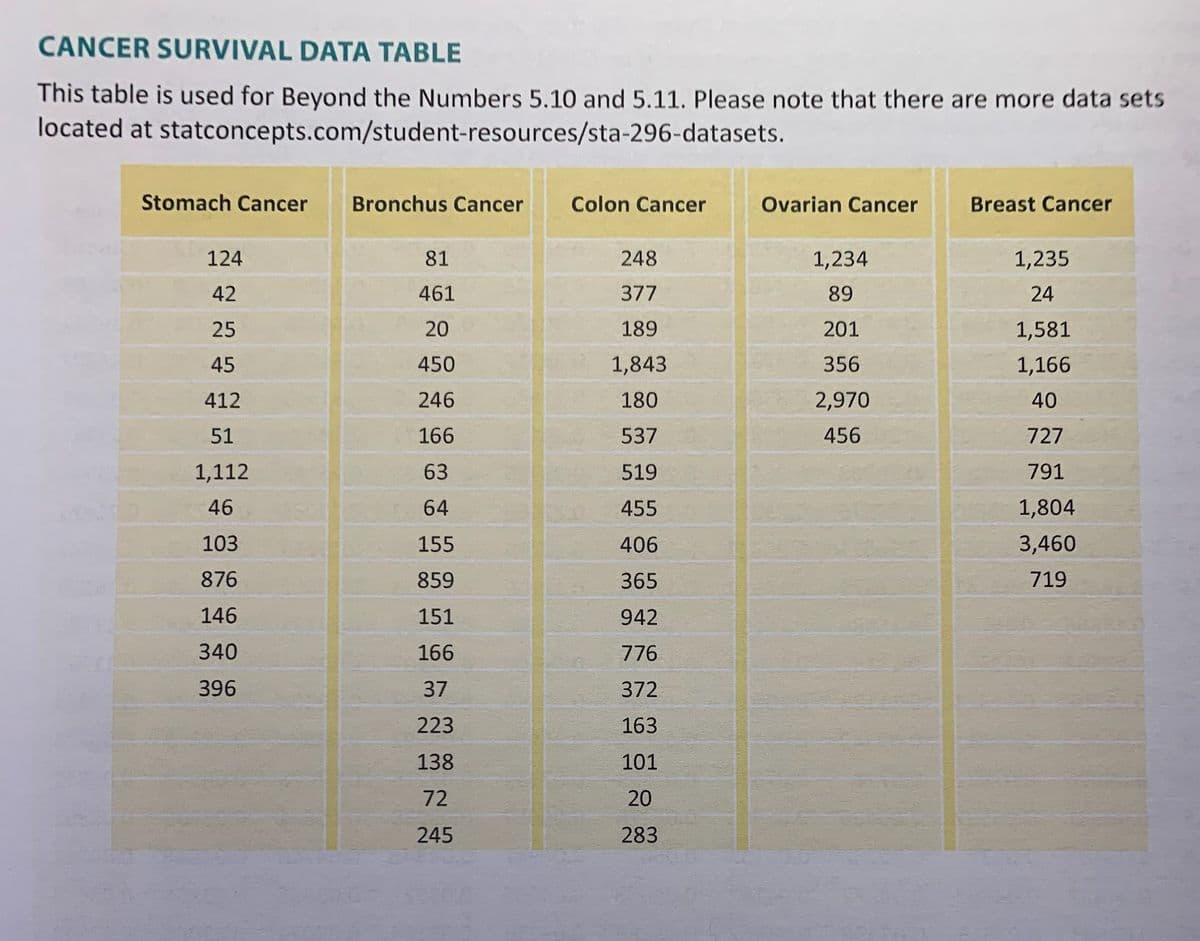
Transcribed Image Text:CANCER SURVIVAL DATA TABLE
This table is used for Beyond the Numbers 5.10 and 5.11. Please note that there are more data sets
located at statconcepts.com/student-resources/sta-296-datasets.
Stomach Cancer Bronchus Cancer
124
42
25
45
412
51
1,112
46
103
876
146
340
396
81
461
20
450
246
166
63
64
155
859
151
166
37
223
138
72
245
Colon Cancer
248
377
189
1,843
180
537
519
455
406
365
942
776
372
163
101
20
283
Ovarian Cancer
1,234
89
201
356
2,970
456
Breast Cancer
1,235
24
1,581
1,166
40
727
791
1,804
3,460
719
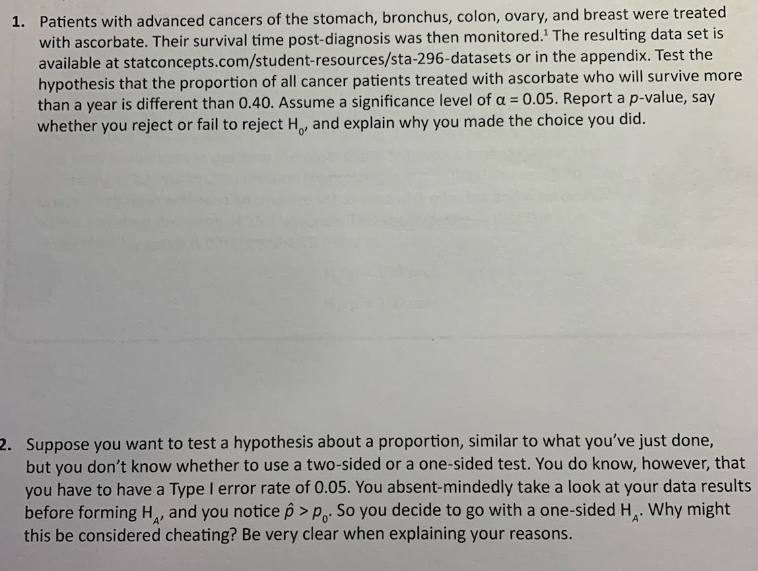
Transcribed Image Text:1. Patients with advanced cancers of the stomach, bronchus, colon, ovary, and breast were treated
with ascorbate. Their survival time post-diagnosis was then monitored. The resulting data set is
available at statconcepts.com/student-resources/sta-296-datasets or in the appendix. Test the
hypothesis that the proportion of all cancer patients treated with ascorbate who will survive more
than a year is different than 0.40. Assume a significance level of a = 0.05. Report a p-value, say
whether you reject or fail to reject Ho, and explain why you made the choice you did.
2. Suppose you want to test a hypothesis about a proportion, similar to what you've just done,
but you don't know whether to use a two-sided or a one-sided test. You do know, however, that
you have to have a Type I error rate of 0.05. You absent-mindedly take a look at your data results
before forming H, and you notice ô > p. So you decide to go with a one-sided H. Why might
this be considered cheating? Be very clear when explaining your reasons.
Expert Solution
This question has been solved!
Explore an expertly crafted, step-by-step solution for a thorough understanding of key concepts.

This is a popular solution!

Trending now
This is a popular solution!

Step by step
Solved in 3 steps with 1 images

Recommended textbooks for you
Glencoe Algebra 1, Student Edition, 9780079039897…
Algebra
ISBN:
9780079039897
Author:
Carter
Publisher:
McGraw Hill
Glencoe Algebra 1, Student Edition, 9780079039897…
Algebra
ISBN:
9780079039897
Author:
Carter
Publisher:
McGraw Hill