Describe the graph you created above. 2. What measures of center and spread would be best to use for weight gained? 3. Is it unusual for a mother in this dataset to gain 71 pounds, or more, while pregnant? Explain your answer completely by referring to the graph and calculations 4. Based on this histogram, what is the most common range of weight gained for mothers in this dataset?
Describe the graph you created above. 2. What measures of center and spread would be best to use for weight gained? 3. Is it unusual for a mother in this dataset to gain 71 pounds, or more, while pregnant? Explain your answer completely by referring to the graph and calculations 4. Based on this histogram, what is the most common range of weight gained for mothers in this dataset?

Holt Mcdougal Larson Pre-algebra: Student Edition 2012
1st Edition
ISBN:9780547587776
Author:HOLT MCDOUGAL
Publisher:HOLT MCDOUGAL
Chapter11: Data Analysis And Probability
Section11.5: Interpreting Data
Problem 1C

Related questions
Question
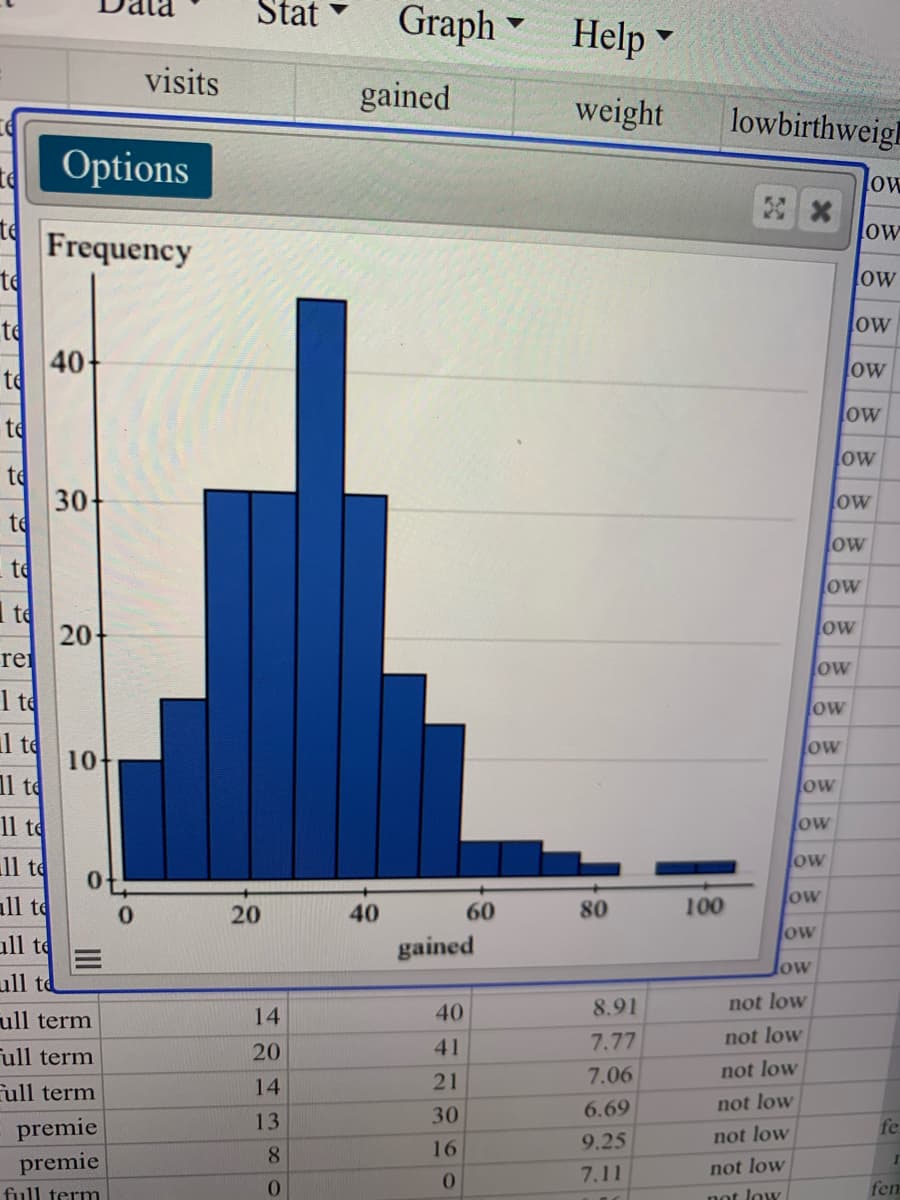
1. Describe the graph you created above.
2. What measures of center and spread would be best to use for weight gained?
3. Is it unusual for a mother in this dataset to gain 71 pounds, or more, while pregnant? Explain your answer completely by referring to the graph and calculations
4. Based on this histogram, what is the most common range of weight gained for mothers in this dataset?
Transcribed Image Text:Stat
Graph
Help -
visits
gained
weight
lowbirthweigh
te
Options
ow
te
ow
Frequency
te
ow
te
ow
40
te
ow
ow
to
low
te
30-
te
ow
low
te
ow
I te
20-
re
ow
ow
1 te
ow
l to
ow
10
11 te
Ow
11 te
ow
1l te
ow
all te
40
60
80
100
ow
20
OW
ull te
gained
ow
ull
8.91
not low
ull term
14
40
7.77
not low
Full term
20
41
7.06
not low
ull term
14
21
6.69
not low
13
30
premie
premie
fe
9.25
not low
8.
16
7.11
not low
full term
0.
not low
fem
II
Expert Solution
This question has been solved!
Explore an expertly crafted, step-by-step solution for a thorough understanding of key concepts.

Step by step
Solved in 4 steps

Recommended textbooks for you
Holt Mcdougal Larson Pre-algebra: Student Edition…
Algebra
ISBN:
9780547587776
Author:
HOLT MCDOUGAL
Publisher:
HOLT MCDOUGAL

Glencoe Algebra 1, Student Edition, 9780079039897…
Algebra
ISBN:
9780079039897
Author:
Carter
Publisher:
McGraw Hill
Holt Mcdougal Larson Pre-algebra: Student Edition…
Algebra
ISBN:
9780547587776
Author:
HOLT MCDOUGAL
Publisher:
HOLT MCDOUGAL
Glencoe Algebra 1, Student Edition, 9780079039897…
Algebra
ISBN:
9780079039897
Author:
Carter
Publisher:
McGraw Hill