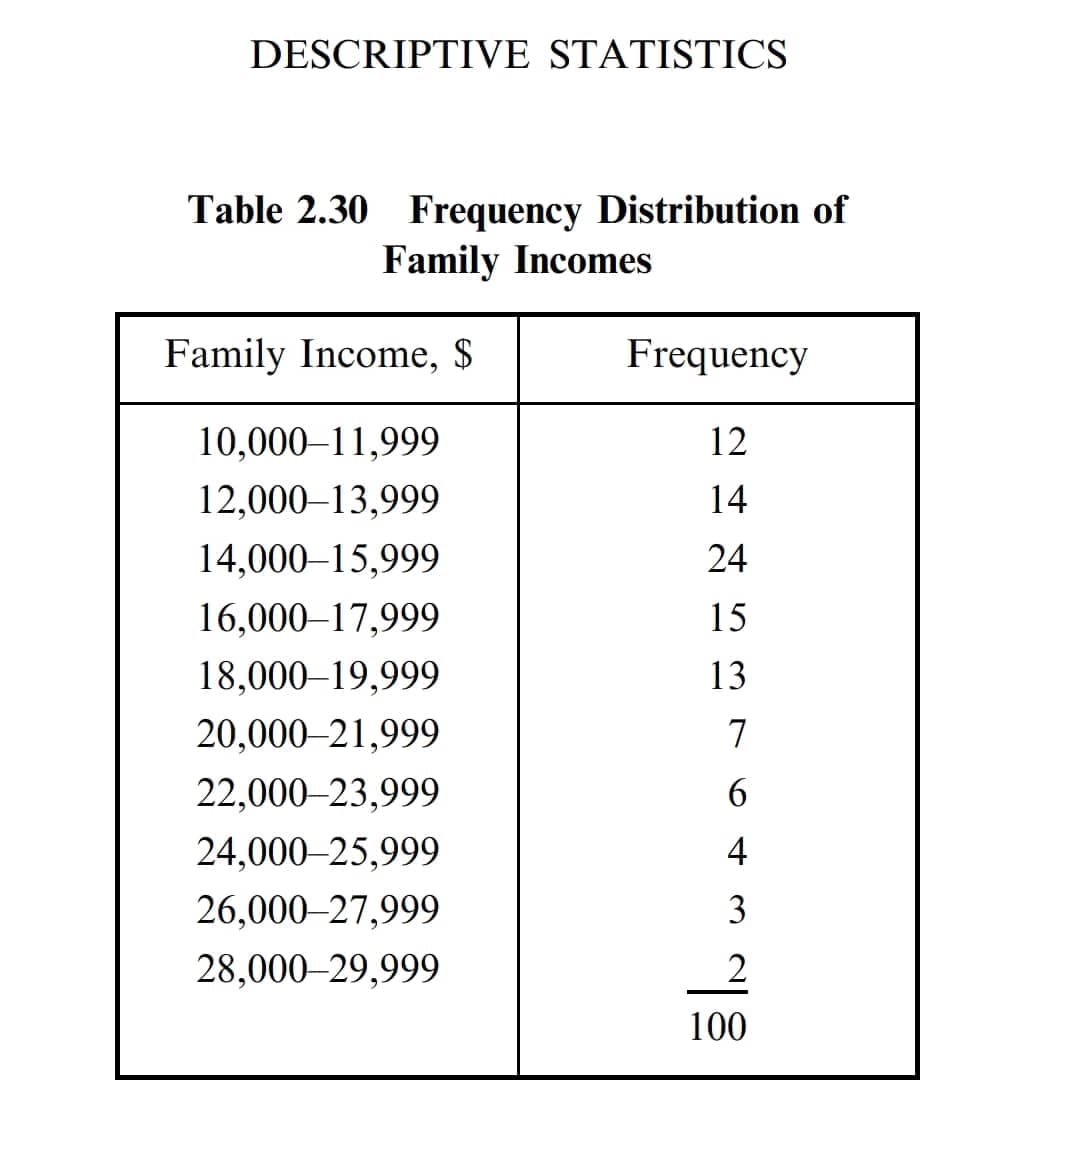
DESCRIPTIVE STATISTICS Table 2.30 Frequency Distribution of Family Incomes

Glencoe Algebra 1, Student Edition, 9780079039897, 0079039898, 2018
18th Edition
ISBN:9780079039897
Author:Carter
Publisher:Carter
Chapter10: Statistics
Section10.1: Measures Of Center
Problem 4GP

Related questions
Question
Answer letter B and C only. Show complete solution. Thanks you!
Transcribed Image Text:DESCRIPTIVE STATISTICS
Table 2.30 Frequency Distribution of
Family Incomes
Family Income, $
10,000-11,999
12,000-13,999
14,000-15,999
16,000 17,999
18,000-19,999
20,000 21,999
22,000-23,999
24,000-25,999
26,000-27,999
28,000-29,999
Frequency
12
14
24
15
13
7
6
4
3
2
100
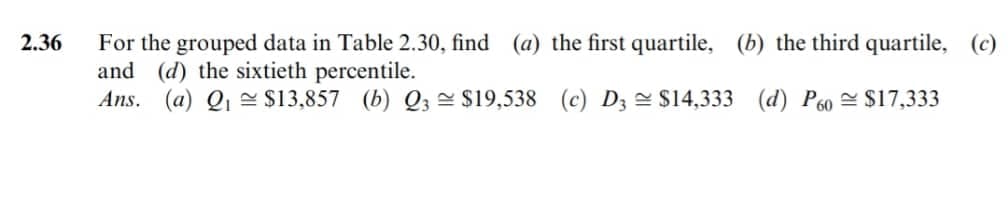
Transcribed Image Text:2.36
For the grouped data in Table 2.30, find (a) the first quartile, (b) the third quartile, (c)
and (d) the sixtieth percentile.
Ans. (a) Q₁ $13,857 (b) Q3 $19,538 (c) D3 $14,333 (d) P60 $17,333
Expert Solution
This question has been solved!
Explore an expertly crafted, step-by-step solution for a thorough understanding of key concepts.

Step by step
Solved in 3 steps

Recommended textbooks for you
Glencoe Algebra 1, Student Edition, 9780079039897…
Algebra
ISBN:
9780079039897
Author:
Carter
Publisher:
McGraw Hill
Glencoe Algebra 1, Student Edition, 9780079039897…
Algebra
ISBN:
9780079039897
Author:
Carter
Publisher:
McGraw Hill