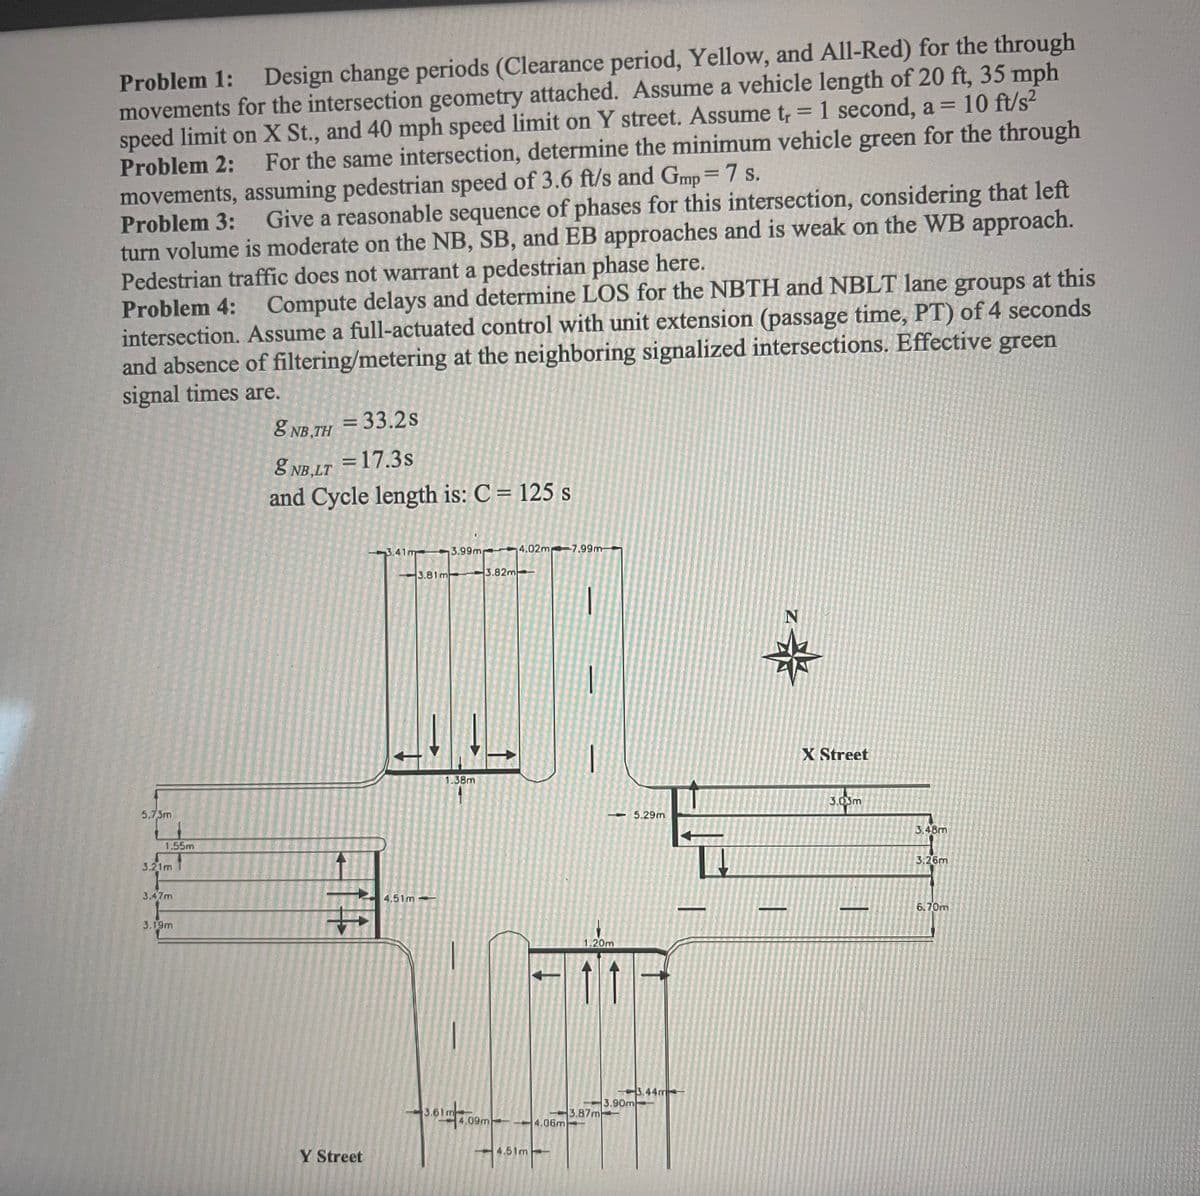
Design change periods (Clearance period, Yellow, and All-Red) for the through movements for the intersection geometry attached. Assume a vehicle length of 20 ft, 35 mph speed limit on X St., and 40 mph speed limit on Y street. Assume t, = 1 second, a = 10 ft/s2 For the same intersection, determine the minimum vehicle green for the through Problem 1: Problem 2: movements, assuming pedestrian speed of 3.6 ft/s and Gmp= 7 s. Problem 3: turn volume is moderate on the NB, SB, and EB approaches and is weak on the WB approach. Pedestrian traffic does not warrant a pedestrian phase here. Problem 4: Give a reasonable sequence of phases for this intersection, considering that left Compute delays and determine LOS for the NBTH and NBLT lane groups at this intersection. Assume a full-actuated control with unit extension (passage time, PT) of 4 seconds and absence of filtering/metering at the neighboring signalized intersections. Effective green signal times are. 8 NB.TH = 33.2s 8 NB,LT =17.3s and Cycle length is: C = 125 s 3.99m 4,02m 7.99m 3.81m 3.82m X Street 1.38m 5.7 Sm 3.0m - 5.29m 1.55m 3.21m 3.26m 3.47m 4.51m- 3.09m 6.70m 3.44m 3.90m 87m 09m 4.06m Y Street 4.51mH
Design change periods (Clearance period, Yellow, and All-Red) for the through movements for the intersection geometry attached. Assume a vehicle length of 20 ft, 35 mph speed limit on X St., and 40 mph speed limit on Y street. Assume t, = 1 second, a = 10 ft/s2 For the same intersection, determine the minimum vehicle green for the through Problem 1: Problem 2: movements, assuming pedestrian speed of 3.6 ft/s and Gmp= 7 s. Problem 3: turn volume is moderate on the NB, SB, and EB approaches and is weak on the WB approach. Pedestrian traffic does not warrant a pedestrian phase here. Problem 4: Give a reasonable sequence of phases for this intersection, considering that left Compute delays and determine LOS for the NBTH and NBLT lane groups at this intersection. Assume a full-actuated control with unit extension (passage time, PT) of 4 seconds and absence of filtering/metering at the neighboring signalized intersections. Effective green signal times are. 8 NB.TH = 33.2s 8 NB,LT =17.3s and Cycle length is: C = 125 s 3.99m 4,02m 7.99m 3.81m 3.82m X Street 1.38m 5.7 Sm 3.0m - 5.29m 1.55m 3.21m 3.26m 3.47m 4.51m- 3.09m 6.70m 3.44m 3.90m 87m 09m 4.06m Y Street 4.51mH

Traffic and Highway Engineering
5th Edition
ISBN:9781305156241
Author:Garber, Nicholas J.
Publisher:Garber, Nicholas J.
Chapter8: Intersection Control
Section: Chapter Questions
Problem 22P

Related questions
Question
Transcribed Image Text:Problem 1: Design change periods (Clearance period, Yellow, and All-Red) for the through
movements for the intersection geometry attached. Assume a vehicle length of 20 ft, 35 mph
speed limit on X St., and 40 mph speed limit on Y street. Assume t, = 1 second, a = 10 ft/s?
Problem 2:
%3D
For the same intersection, determine the minimum vehicle green for the through
movements, assuming pedestrian speed of 3.6 ft/s and Gmp 7 s.
Problem 3:
turn volume is moderate on the NB, SB, and EB approaches and is weak on the WB approach.
Pedestrian traffic does not warrant a pedestrian phase here.
Give a reasonable sequence of phases for this intersection, considering that left
Compute delays and determine LOS for the NBTH and NBLT lane groups at this
intersection. Assume a full-actuated control with unit extension (passage time, PT) of 4 seconds
and absence of filtering/metering at the neighboring signalized intersections. Effective green
signal times are.
Problem 4:
=D33.2s
%3D
8 NB,TH = 33.2s
8 NB,LT =17.3s
and Cycle length is: C = 125 s
%3D
3.41m
3.99m
4.02m 7.99m-
3.81m
3.82m
X Street
1.38m
3.03m
5.73m
- 5.29m
3.48m
1.55m
3.26m
3.21m
3,47m
4.51m
6.70m
3.19m
1.20m
3,44m
3.90m
3.87m
4,09m
4.06m
Y Street
4.51m-
Transcribed Image Text:4
1
S
S
S
5
6
7
8.
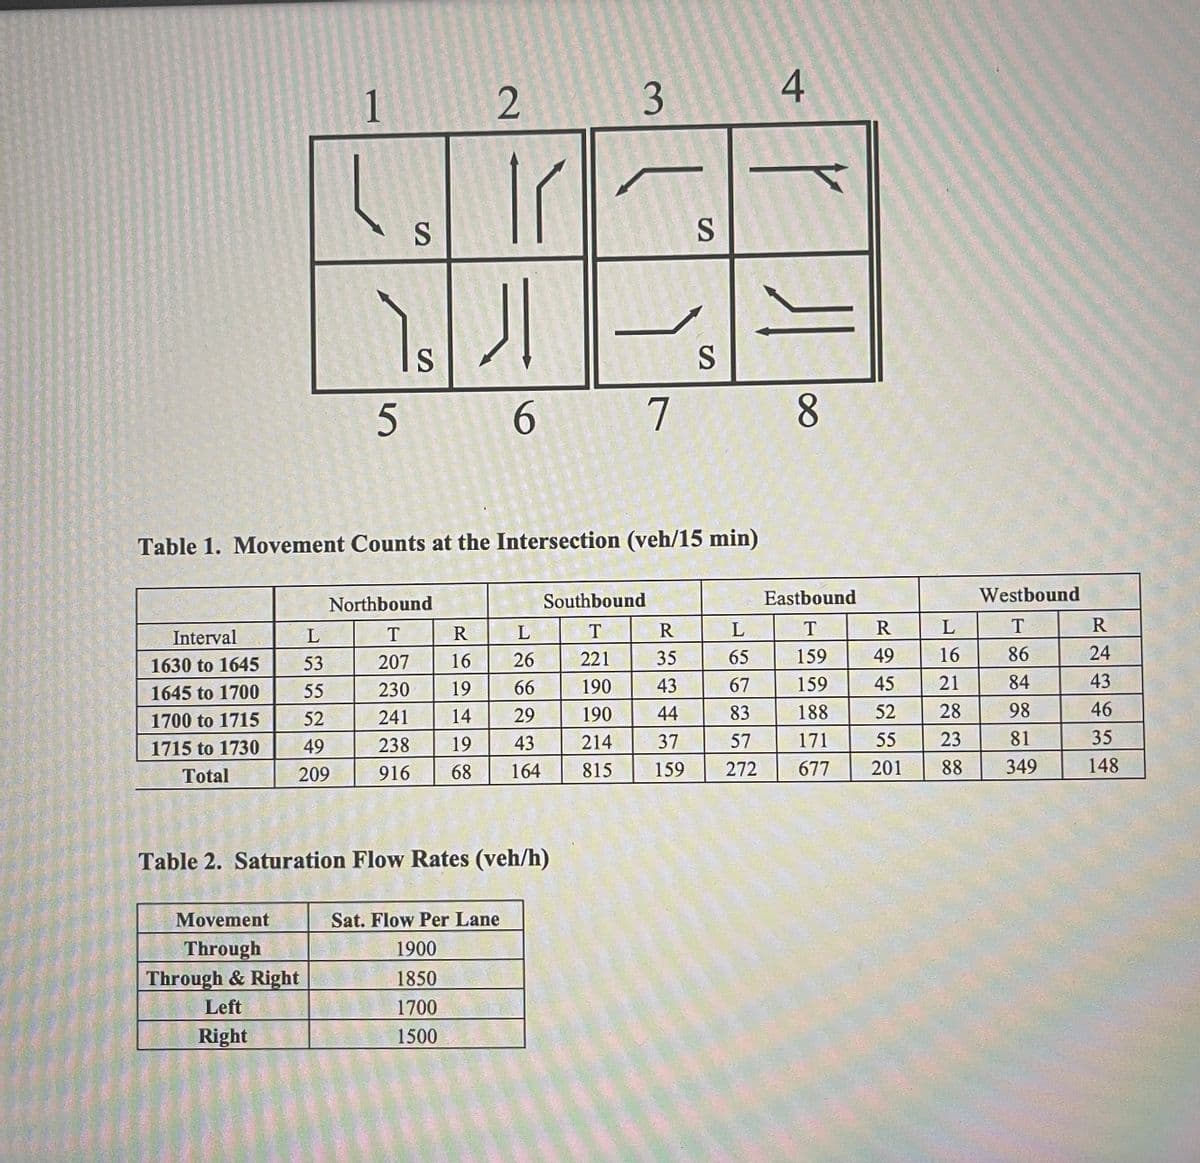
Table 1. Movement Counts at the Intersection (veh/15 min)
Northbound
Southbound
Eastbound
Westbound
Interval
L
R
T
R
1630 to 1645
53
207
16
26
221
35
65
159
49
16
86
24
55
230
19
66
190
43
67
159
45
21
84
43
1645 to 1700
1700 to 1715
52
241
14
29
190
44
83
188
52
28
98
46
1715 to 1730
49
238
19
43
214
37
57
171
55
23
81
35
Total
209
916
68
164
815
159
272
677
201
88
349
148
Table 2. Saturation Flow Rates (veh/h)
Movement
Sat. Flow Per Lane
Through
Through & Right
1900
1850
Left
1700
Right
1500
2.
Expert Solution
This question has been solved!
Explore an expertly crafted, step-by-step solution for a thorough understanding of key concepts.

This is a popular solution!

Trending now
This is a popular solution!

Step by step
Solved in 4 steps

Knowledge Booster


Learn more about
Need a deep-dive on the concept behind this application? Look no further. Learn more about this topic, civil-engineering and related others by exploring similar questions and additional content below.Recommended textbooks for you
Traffic and Highway Engineering
Civil Engineering
ISBN:
9781305156241
Author:
Garber, Nicholas J.
Publisher:
Cengage Learning
Traffic and Highway Engineering
Civil Engineering
ISBN:
9781305156241
Author:
Garber, Nicholas J.
Publisher:
Cengage Learning