Destination Source Сарacity Abilene Tyler San Angelo $60 $50 $40 Odessa 12,000 $70 $30 $90 Вryan 10,000 Demand 8,000 10,000 4,000 22,000 A FIGURE 13.13 Transportation Tableau for Prescott Industries


Q: The following table gives the map coordinates and the shipping loads for a set of cities that we…
A: Locating a hub(distribution center) at the central position is best possible alternative which can…
Q: Trucks supply each franchise on a daily basis. Determine the shortest route from the warehouse at…
A: The answer is as below:
Q: Y Сарacity A 4 3 100 8. 4 300 C 9 7 5 300 Demand 300 200 200 3. B
A: The transportation issue is a kind of Linear Programming Problem (LPP) in which items are carried…
Q: Suppose that the shipments for the problem depicted in Figure 8.1A are not all equal, but instead…
A: Given data Destination x y Weekly Quantity D1 2 2 800 D2 3 5 900…
Q: Which of the following technique emphasizes transportation cost in the determination of facility…
A: a) Location rating factor technique - Location rating factor emphasizes on the production-related…
Q: 2. Frieda Millstone and her family live in Roanoke, Virginia, and they are planning an auto vacation…
A: Dijkstra's shortest-path calculation to figure the shortest path from 1 to all arrange hubs is as…
Q: Consider the following transportation problem. Find the starting solution by using North-wes corner…
A: THE ANSWER IS AS BELOW:
Q: 2. A company has three branches: Manila Branch, Davao Branch, and Tacloban Branch. These branches…
A: Given data is
Q: Reddy & Sons Electronics Company has 3 plants and 4 warehouses in Telangana. The transportation ost…
A: Given: Warehouse1 Warehouse2 Warehouse3 Warehouse4 Supply Plant1 3 1 7 4 300 Plant2 2 6 5 9…
Q: 12. Major Motors produces its Trans National model in three plants located in Flint, Michigan;…
A: a), b) The problem is first converted into a balanced transportation problem and solved using Solver…
Q: Which of the following is NOT a method to develop an initial solution to a transportation model? -…
A: The transportation model explains that how one product is transferred to another destination with…
Q: Johan Company produces computers in plants located at towns A, B, and C. The computers are sent to…
A:
Q: a. Formulate the problem as a transportation model. b. Determine an economical distribution plan. c.…
A: The transportation model is used to calculate the minimum cost of the route by selecting different…
Q: Explain the strategic impact of facility location decision on logistics performance?
A: Logistics and supply chain management encompasses a broad spectrum of activities. To mention a few,…
Q: DM Office Products (DMOP) Is a wholesale supplier of office products with one facility in…
A: Given data,
Q: Companies A, B, and C supply components to three plants (F, G, and H) via two crossdocking…
A: It costs $4 to ship from D regardless of final destination and $3 to ship to E regardless of…
Q: DM Office Products (DMOP) Is a wholesale suppler of office products with one facility In…
A: The centroid approach helps the organizations to recognize the location of facilities utilized for…
Q: Brief information about the current situation of such interchange points. b) Comparison in terms of…
A: The profit of the port during this regard is mostly patterned as so much as holders prohibited per…
Q: An e-commerce company located in Alabama is considering two options for delivery of customer orders.…
A: Crossover point = Difference of Fixed cost (indifference point) Difference of Variable cost
Q: The following table gives the map coordinates and the shipping loads for a set of cities that we…
A: Given data: City Map co-ordinate (x,y) Shipping load A (5,10) 5 B (6,8) 10 C (4,9) 15 D…
Q: Make a Transportation System so that the allocation/distribution of rice is optimum and at what…
A: Finding Solution using North-West Corner method, also find optimal solution using stepping stone…
Q: Hard Rock Concrete Supply makes concrete at its plant in Centerville, Virginia, and delivers it to…
A: The shortest route helps in to determine or calculating the short route from the starting point i.e.…
Q: You need to locate a distribution center to serve the West Coast. Using the map below, find the…
A: This question is related to the topic- Location planning and strategy and this topic falls under the…
Q: LM.61 Boxmart needs to set up a new hub to distribute to a number of stores in four cities. The…
A:
Q: Contrast the location of a food distributor and a supermarket. (The distributor sends truckloads of…
A: Location analysis is a technique for finding, assessing and specifying the proper placement of…
Q: Using the intuitive least cost method for the given transportation problem, answer the following:…
A: Given Information:
Q: a. If traffic between the staging area and the first two construction sites (2,2) and (1,4) is 50…
A: The coordinates of the staging area, can be determined through center of gravity.
Q: Pro-Carpet company manufactures carpets in Northwest Indiana and delivers them to warehouses and…
A: In order to save cost and time, the shortest path method is used. The shortest path refers to the…
Q: Why are most location decisions analyzed by a team of managers instead of a single person? What…
A: For the following reasons, most location decisions are analyzed by a team of managers instead of a…
Q: A manufacturer of certain household goods caters primarily to the south Indian market. At present,…
A: Problem Table is Hyderabad Mysore Madras Kochi Pune Vizag Supply Warehouse A 60 70 10 30 90…
Q: In the original RedBrand problem, suppose the plantscannot ship to each other and the customers…
A: In the original RedBradn problem, the inputs of common capacity were 200 and further, the…
Q: 4. Three refineries with daily capacities of 6, 5, and 8 million gallons, respectively, supply three…
A: ANSWER IS AS BELOW:
Q: The following table gives the map coordinates and the shipping loads for a set of cities that we…
A: Given data is
Q: A) Shipper: J&J Company 123 John Street Toronto, ON, Canada, L5R 2N3 Shipment:…
A:
Q: Santa Cruz Bottling is a manufacturer of organic soft drinks on the coast of central California. Its…
A: The centroid method is an agglomerative bunching method, during which the likenesses (or…
Q: The Arid Company makes canoe paddles to serve distribution centers in Worchester, Rochester, and…
A: The material allocation in the given transportation model are: Battle Creek to Rochester:- 12000…
Q: a) Formulate an initial feasible solution to Carib Cement Company transportation problem using VAM.…
A: The Transportation Method is used to study efficiency related to the transportation routes. This…
Q: Obtain the initial basic feasible solution to the following transportation problem using north-…
A: Given data, O1, O2, O3, O4 are the origins D1, D2, D3, D4 are requirements D1 D2 D3…
Q: An e-commerce company located in Alabama is considering two options for delivery of customer orders.…
A:
Q: 8.20 The following table gives the map coordinates and the shipping loads for a set of cities that…
A: Given - City Coordinates Shipping Loads A (5,10) 5 B (6,8) 10 C (4,9) 15 D (9,5) 5 E…
Q: 1. Suisan fish company distributes fishes in Big Island and delivers them to warehouses, retail…
A: From the network diagram, Spot each node and their next path Add their values. Ex G-W = 10 ,G-W-E…
Q: Your fast-food outlet, Burger Queen, has obtained a license to open branches in three closely…
A: The payoff matrix of the situation where Burger queen along with its competitor can open an outlet…
Q: . A company has a central supply facility and a distribution center located 400miles away. The…
A: Given Central supply product cost P=$75 Transportation rates from central supply TR=$60/unit…
Q: Find the initial transportation cost for the transportation matrix given using North-West corner…
A: Find the given details below: Given Details Destination Supply 1 2 3 4 Source A 5 6 7 8…
Q: . The XYZ engineering organization produces the product P in locations T and S to be transported to…
A: Find the Given details below: Given details: Locations L M N Supply T 2 4 2 120 S 3 1 9…

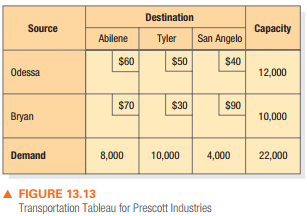
Prescott Industries transports sand and stone extracted from
its open-pit mines located in Odessa and Bryan to its con-
crete block manufacturing facilities in Abilene, Tyler, and San
Angelo. For the capacities, locations, and shipment costs per
truckload shown in the Figure 13.13, determine the shipping
pattern that will minimize transportation costs. What are the
estimated transportation costs associated with this optimal
allocation pattern?


Trending now
This is a popular solution!

Step by step
Solved in 4 steps


- 2. In this question, we will explore factors that influence growth for a company both growth in sales volume and growth in price. Describe one firm specific strategic factor, one industry specific factor, and one economywide factor that could impact one’s forecast of sales volume. Describe one firm specific strategic factor, one industry specific factor, and one economywide factor that could impact growth in prices as well.Method of Least Squares, Goodness of Fit Deepa Dalal opened a free-standing radiology clinic. She had anticipated that the costs for the radiological tests would be primarily fixed, but she found that costs increased with the number of tests performed. Costs for this service over the past nine months are as follows: Month Radiology Tests Total Cost January 2,800 $133,500 February 2,600 135,060 March 3,100 175,000 April 3,500 170,600 May 3,400 176,900 June 3,700 186,600 July 3,840 174,450 August 4,100 195,510 September 3,450 185,300 Required: 1. Compute the cost formula for radiology services using the method of least squares. If required, round your answers to two decimal places. Y = + X 2. Using the formula computed in Requirement 1, what is the predicted cost of radiology services for October for 3,500 appointments? (Round the answer to the nearest dollar.)Earthquake, drought, fire, economic famine, flood, and apestilence of TV court reporters have caused an exodus fromthe City of Angels to Boulder, Colorado. The sudden increasein demand is straining the capacity of Boulder’s electricalsystem. Boulder’s alternatives have been reduced to buying150,000 MWh of electric power from Tri-County G&T at aprice of $75 per MWh, or refurbishing and recommissioning the abandoned Pearl Street Power Station in downtownBoulder. Fixed costs of that project are $10 million per year,and variable costs would be $35 per MWh. Should Boulderbuild or buy?
- Harrison Hotels is considering adding a spa to its currentfacility in order to improve the list of amenities. Operating thespa would require a fi xed cost of $25,000 per year. Variable costis estimated at $35 per customer. Th e hotel wants to break even if12,000 customers use the spa facility.(a) Construct a spreadsheet model, assuming that sellingprice is an input to be specifi ed by the user.(b) Use Goal Seek to fi nd the selling price for which the hotelwill break even4.1REQUIREDStudy the information given below and calculate the following if the sales manager’s proposal is accepted:4.1.1 Break-even quantity.4.1.2 The number of units that must be sold to achieve the company’s profit objective. INFORMATIONSirloin Enterprises manufactures a product that sells for R9 each. The company presently produces and sells 90 000 units per year. Total variable manufacturing costs and selling costs are R405 000 and R81 000 (10% of sales) respectively. Fixed costs are R226 440 for manufacturing overheads and R97 200 for selling and administrative activities.The sales manager has proposed that the price be increased to R10.80 per unit. The company’s profit objective is 10% of sales. 4.2 ENO Ltd, a pharmaceutical company, is seeking finance for the development of a vaccine aimed at reducing the spread the Corona virus. The company is seeking funding only from the public in the form of equity as well as long-term borrowing.In light of the above, critically discuss…SUBJECT : OPERATION RESEARCH 1. When problem become unrestricted after changing primal to dual simplex Method justify your statement with valid example. 2. Solve the following problem after finding its dual. Min z = x1 - 3x2 + 3x3 s.t. 3x1 - x2 + 2 x3 ≤ 7 2x1 + 4x2 ≥ -12 -4x1 + 3x2 + 8x3 ≤ 10 x1, x2, x3 ≥ 0
- Variable cells Cell Name Final Value Reduced Cost Objective Coefficient Allowable Increase Allowable Decrease $B$6 Activity 1 0 425 500 1E+30 425 $C$6 Activity 2 27.5 0.0 300 500 300 $D$6 Activity 3 0 250 400 1E+30 250 Constraints Cell Name Final Value Shadow Price Constraint R.H. Side Allowable Increase Allowable Decrease $E$2 Benefit A 110 0 60 50 1E+30 $E$3 Benefit B 110 75 110 1E+30 46 $E$4 Benefit C 137.5 0 80 57.5 1E+30 If the coefficient for Activity 1 in the objective function changes to $50, then the objective function value: Multiple Choice will decrease by $450. is $0. will decrease by $2750. will remain the same. can only be discovered by resolving the problem.You are the owner of Caché, a chain of women's clothing boutiques. Your state has a sales tax of 7%, and your city has an additional sales tax of 1.5%. Each quarter you are responsible for making these tax deposits to the city and state. Last quarter your stores had total revenue, including sales tax, of $488,250. a) How much of this revenue was sales (in $) and how much was sales tax (in $)? sales sales tax b) How much sales tax (in $) should be sent to the city? c)How much sales tax (in $) should be sent to the state?2. Analyze the situation and answer the following questions. Ed and Barbara Bonneau started their wholesale sunglass distribution firm 30 years ago with $1,000 of their own money and $5,000 borrowed from a country banker in Ed’s hometown. The firm grew quickly, selling sunglasses and reading glasses to such companies as Wal-Mart, Eckerd Drugs, and Phar-Mor. In addition, the Bonneaus enjoyed using the company to do good things. For example, they had a company chaplain, who was available when employees were having family problems, such as a death in the family.Although the company had done well, the market had matured recently and profit margins narrowed significantly. Wal-Mart, for example, was insisting on better terms, which meant significantly lower profits for the Bonneaus. Previously, Ed had set the prices that he needed to make a good return on his investment. Now, the buyers had consolidated, and they had the power. Ed didn’t enjoy running the company as much as he had in the…
- Problem 17 page 552The chancellor of a small regional college is concernedabout the declining freshman enrollment at his college. A number of factors have contributed to the decline, butthe chancellor believes it is directly related to annualtuition increases. He has collected the following data forthe past 8 years.year FreshmanEnrollmentAnnualTuition (In USdollars)1 6,550 32,0002 6,230 37,0003 5,980 45,2004 5,540 45,7005 4,960 46,2006 4,630 46,7007 4,520 52,2008 4,220 57,700a Develop a linear regression equation for forecastingfreshman enrollment as a function of the annual tuition.b Forecast freshman enrollment if the annual tuitionincreases by US$9,000 in Year 9.c Evaluate the "goodness of fit" of the regressionequation by computing the values of R2, r, and Syx and interpret the results.fter spending $300,000 for research and development, chemists at Diversified Citrus Industries have developed a new breakfast drink. The drink, called Zap, will provide the consumer with twice the amount of vitamin C currently available in breakfast drinks. Zap will be packaged in an 8-ounce can and will be introduced to the breakfast drink market, which is estimated to be equivalent to 21 million 8-ounce cans nationally. One major management concern is the lack of funds available for marketing. Accordingly, management has decided to use newspapers (rather than television) to promote Zap in the introductory year and distribute Zap in major metropolitan areas that account for 65 percent of U.S. breakfast drink volume. Newspaper advertising will carry a coupon that will entitle the consumer to receive $0.20 off the price of the first can purchased. The retailer will receive the regular margin and be reimbursed for redeemed coupons by Diversified Citrus Industries. Past experience…1. Define the problem a. clearly describe the most critical strategic problem facing Hālau Online b. Justify the choices of the most critical problem facing Hālau Online by citing relevant factors which may be internal and/or external.