Determine an appropriate number of classes and class width required to construct a grouped frequency distribution for data sets with the following values: a. n = 190 Minimum Number of Classes: Class Width: Round to the nearest whole number Minimum b. n = 96 Number of Classes: = - 32 Maximum = 346 www 0.27 Maximum - 1.96
Determine an appropriate number of classes and class width required to construct a grouped frequency distribution for data sets with the following values: a. n = 190 Minimum Number of Classes: Class Width: Round to the nearest whole number Minimum b. n = 96 Number of Classes: = - 32 Maximum = 346 www 0.27 Maximum - 1.96

Glencoe Algebra 1, Student Edition, 9780079039897, 0079039898, 2018
18th Edition
ISBN:9780079039897
Author:Carter
Publisher:Carter
Chapter10: Statistics
Section10.3: Measures Of Spread
Problem 1GP

Related questions
Question
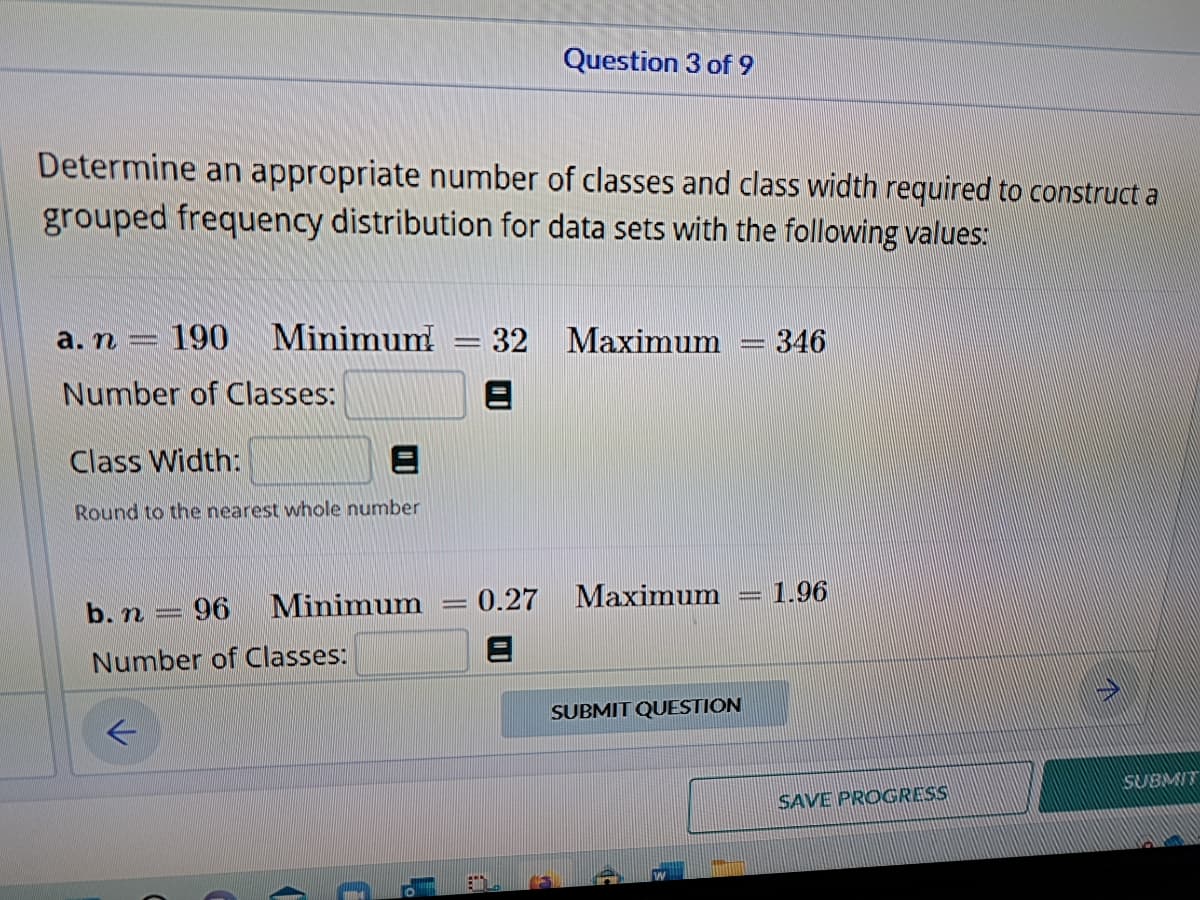
Transcribed Image Text:Determine an appropriate number of classes and class width required to construct a
grouped frequency distribution for data sets with the following values:
a. n- 190 Minimum! - 32 Maximum = 346
Number of Classes:
Class Width:
Round to the nearest whole number
b. n = 96 Minimum
Number of
Classes:
(
C
L
Question 3 of 9
-
0.27
Maximum 1.96
SUBMIT QUESTION
SAVE PROGRESS
SUBMIT
Expert Solution
This question has been solved!
Explore an expertly crafted, step-by-step solution for a thorough understanding of key concepts.

Step by step
Solved in 3 steps

Recommended textbooks for you
Glencoe Algebra 1, Student Edition, 9780079039897…
Algebra
ISBN:
9780079039897
Author:
Carter
Publisher:
McGraw Hill

Holt Mcdougal Larson Pre-algebra: Student Edition…
Algebra
ISBN:
9780547587776
Author:
HOLT MCDOUGAL
Publisher:
HOLT MCDOUGAL

Glencoe Algebra 1, Student Edition, 9780079039897…
Algebra
ISBN:
9780079039897
Author:
Carter
Publisher:
McGraw Hill
Holt Mcdougal Larson Pre-algebra: Student Edition…
Algebra
ISBN:
9780547587776
Author:
HOLT MCDOUGAL
Publisher:
HOLT MCDOUGAL