Determine graphically the beta coefficients for Stocks A and B. b. Graph the Security Market Line, and give its equation. Calculate the required rates of return on Stocks A and B. a. C.
Determine graphically the beta coefficients for Stocks A and B. b. Graph the Security Market Line, and give its equation. Calculate the required rates of return on Stocks A and B. a. C.

Essentials Of Investments
11th Edition
ISBN:9781260013924
Author:Bodie, Zvi, Kane, Alex, MARCUS, Alan J.
Publisher:Bodie, Zvi, Kane, Alex, MARCUS, Alan J.
Chapter1: Investments: Background And Issues
Section: Chapter Questions
Problem 1PS

Related questions
Question
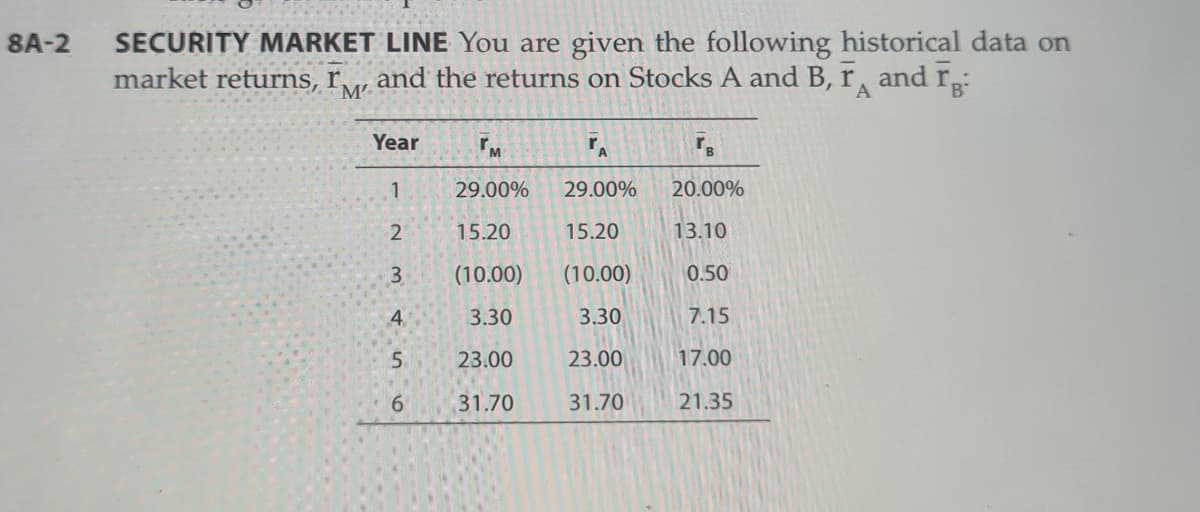
Transcribed Image Text:SECURITY MARKET LINE You are given the following historical data on
market returns, r
8A-2
and the returns on Stocks A and B, r, and rp:
M
A
Year
M
1
29.00%
29.00%
20.00%
15.20
15.20
13.10
(10.00)
(10.00)
0.50
4
3.30
3.30
7.15
23.00
23.00
17.00
6.
31.70
31.70
21.35
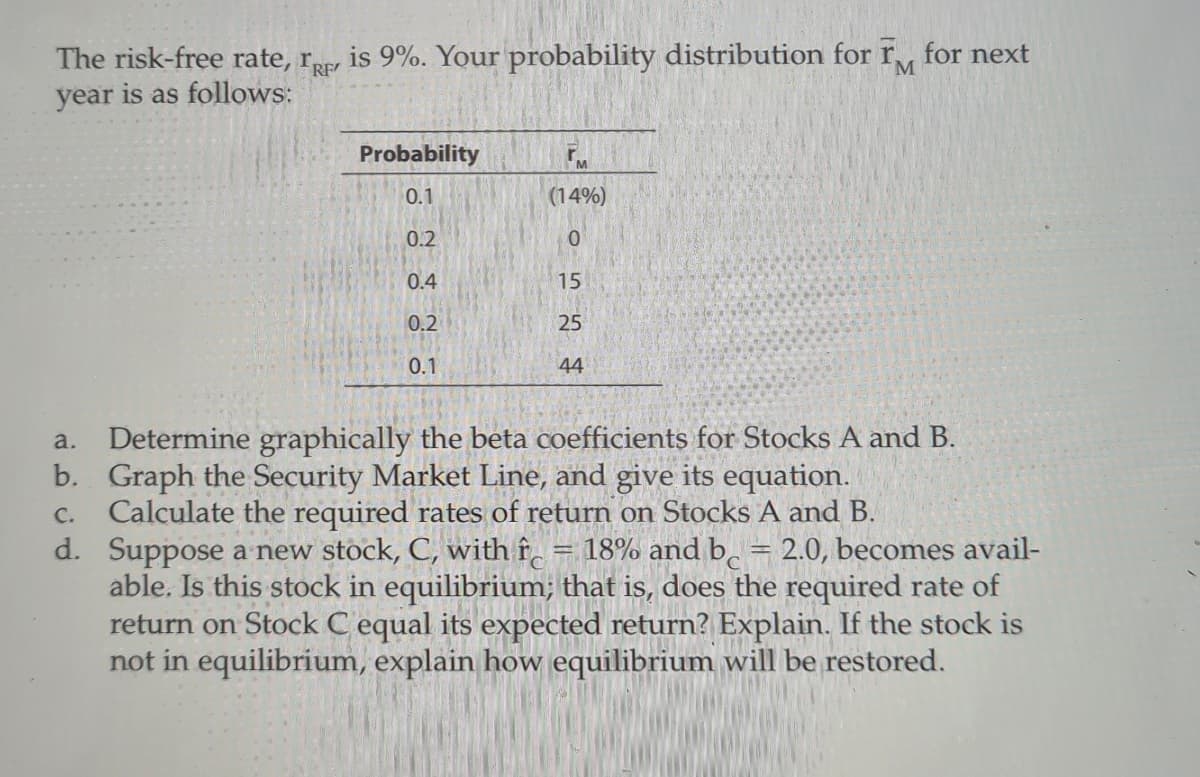
Transcribed Image Text:The risk-free rate, r is 9%. Your probability distribution for r, for next
year is as follows:
Probability
0.1
(14%)
0.2
0.4
15
0.2
25
0.1
44
Determine graphically the beta coefficients for Stocks A and B.
b. Graph the Security Market Line, and give its equation.
Calculate the required rates of return on Stocks A and B.
d. Suppose a new stock, C, with f̟ = 18% and b̟ = 2.0, becomes avail-
able. Is this stock in equilibrium; that is, does the required rate of
return on Stock C equal its expected return? Explain. If the stock is
not in equilibrium, explain how equilibrium will be restored.
a.
C.
Expert Solution
This question has been solved!
Explore an expertly crafted, step-by-step solution for a thorough understanding of key concepts.

Step by step
Solved in 6 steps with 5 images

Knowledge Booster


Learn more about
Need a deep-dive on the concept behind this application? Look no further. Learn more about this topic, finance and related others by exploring similar questions and additional content below.Recommended textbooks for you
Essentials Of Investments
Finance
ISBN:
9781260013924
Author:
Bodie, Zvi, Kane, Alex, MARCUS, Alan J.
Publisher:
Mcgraw-hill Education,


Essentials Of Investments
Finance
ISBN:
9781260013924
Author:
Bodie, Zvi, Kane, Alex, MARCUS, Alan J.
Publisher:
Mcgraw-hill Education,

Foundations Of Finance
Finance
ISBN:
9780134897264
Author:
KEOWN, Arthur J., Martin, John D., PETTY, J. William
Publisher:
Pearson,

Fundamentals of Financial Management (MindTap Cou…
Finance
ISBN:
9781337395250
Author:
Eugene F. Brigham, Joel F. Houston
Publisher:
Cengage Learning

Corporate Finance (The Mcgraw-hill/Irwin Series i…
Finance
ISBN:
9780077861759
Author:
Stephen A. Ross Franco Modigliani Professor of Financial Economics Professor, Randolph W Westerfield Robert R. Dockson Deans Chair in Bus. Admin., Jeffrey Jaffe, Bradford D Jordan Professor
Publisher:
McGraw-Hill Education