

Q: Which of the following is not a characteristic of the mean? O Its value can be influenced. It can be…
A: Given that Which of the following is not a characteristic of the mean? Its value can be…
Q: (a) Find the median. (b) Find the interquartile range (showing Q3 and Q1 in the process). (c) Find…
A: Given: Since you have posted a question with multiple sub-parts, we will solve first three subparts…
Q: e following are examples of unbiased estimators. Check all th sample mean | sample variance
A: A statistic is said to be unbiased when there is no difference between estimator’s expected value…
Q: These are scores from a following test: 3, 5, 8, 6, 7, 7, 10, 7, 9, 8 Find the following: A)…
A: “Since you have posted a question with multiple sub-parts, we will solve first three sub-parts for…
Q: .ccording to the below table, calculate the weighted mean. Frequency 2 5 Number of Laptops 1 2 3 4 O…
A: For the given data Find Weighted mean = ?
Q: standard deviation
A: Given data: Mean = 68 Intervals Frequency 42-54 2 54-66 18 66-78 56 To find the standard…
Q: Given the frequency table below of the students result in 25 point quiz. Compute its mean.
A: Let x denotes the class mark and f be the frequency. The mean can be calculated as Mean = ∑f.x /∑f
Q: In a randomized study, the following scores are obtained per group. Test the ascension of…
A: Denote μ1,μ2,μ3, µ as the mean scores among the three treatment groups 1, 2, 3, and 4 respectively.…
Q: See the attached image dataset, use the dataset to answer the following question: A) By hand, find…
A: The mean value is the average of all the observed value in the dataset. Median is another measure of…
Q: CCN and ActMedia provided a television channel targeted to individuals waiting in supermarket…
A: Given CCN and ActMedia provided a television channel targeted to individuals waiting in supermarket…
Q: a. Calculate the mean and median for these data. Are these values of the mean and the median sample…
A: mean =(sum of term )÷(number of term) Median = value which is situated in the middle of the series.…
Q: A quiz on mathematical language and symbols was administered to students of H137IHM at Lyceum of the…
A: It is been asked to find Interquartile Range, Variance and Standard deviation using given data.
Q: Using the population formula, calculate the mean, variance, and standard deviation for the following…
A: Hello! As you have posted 2 different questions, we are answering the first question. In case you…
Q: When estimating the mean age of a population of 5000 individuals, a simple random sample of 50…
A:
Q: The amounts with a mean a produces thes The supportim nicotine amou
A: A z-score represents the position of a data point in terms of its distance from the mean when…
Q: Using this data set find variance and standard deviation: 9, 12, 13, 16, 23, 40, 48. Show your work
A: Given, the data for which we need to find variance and standard deviation The mean for the data is…
Q: The life span in Honolulu is approximately normally distributed. The mean life span is 77 years. A…
A:
Q: A recent study investigated tractor skidding distances along a road in a forest. The skidding…
A:
Q: CCN and ActMedia provided a TV channel targeted to individuals waiting in supermarket checkout…
A:
Q: b) Find the Mean, Median, Mode, Standard Deviation, Range, and IQR of the age data. Mean: Median:…
A: The following data is given: Sex weight Age Male 12 11 Female 9 2 Female 8 12 Male 10 15…
Q: : 1460, 1550, 1600, 1620, 1640, 1660, 1740, 1820 D : 1510, 1520, 1530, 1570, 1600, 1680 Perform an…
A:
Q: Which average is affected most by extreme values Oa. Median O b. Arithmetic Mean OC. Mode Od.…
A: Median is the middle-most value of the sorted data. Removing extreme values does not affect much the…
Q: Using the descriptive statistics above, find the sample variance.
A: Measure of central tendency measures the central or average value of a dataset. Measures of…
Q: Variance value for the following data: 69.93,75,82,74,88,86 82.43 O 74.66 O 87.26 O
A:
Q: Calculate the mean, mean deviation, variance, standard deviation, and coefficient of change.
A: First, we calculate the relative frequency for each value of X. f X Relative frequency (rf) X*rf…
Q: Compute the weighted mean for the following data
A: 19 12 228 17 30 510 14 28 392 13 10 130 18 10 180
Q: Collected data: GPA of working students (working 20 hours and more per week): 2.02 2.12 2.17…
A: To Calculate mean, first we add all the observations and divide the sum with the sample size. So…
Q: A researcher is interested whether a training course increases the teaching performance of the…
A: Use paired t - test distribution, if you have pair measures on the same subject. In our case, we…
Q: Which of the following represents the fiftieth percentile, or the middle point in a set of numbers…
A:
Q: Look again at the choir teacher's summary of attendance Number of learners at choir practice 3)…
A: To find: The approximate value of the mean number of learners who attend choir practice
Q: ratings employees of a certain department were taken and are shown below. 81, 86, 68, 69, 78, 93,…
A: We know that Mean = sum of all observations/total number of observations. NOTE:- According to…
Q: Q1. (a)Define Statistics. Explain the characteristics and limitations of statistics.
A: Here we have to define the Statistics and also their characteristics and limitations.
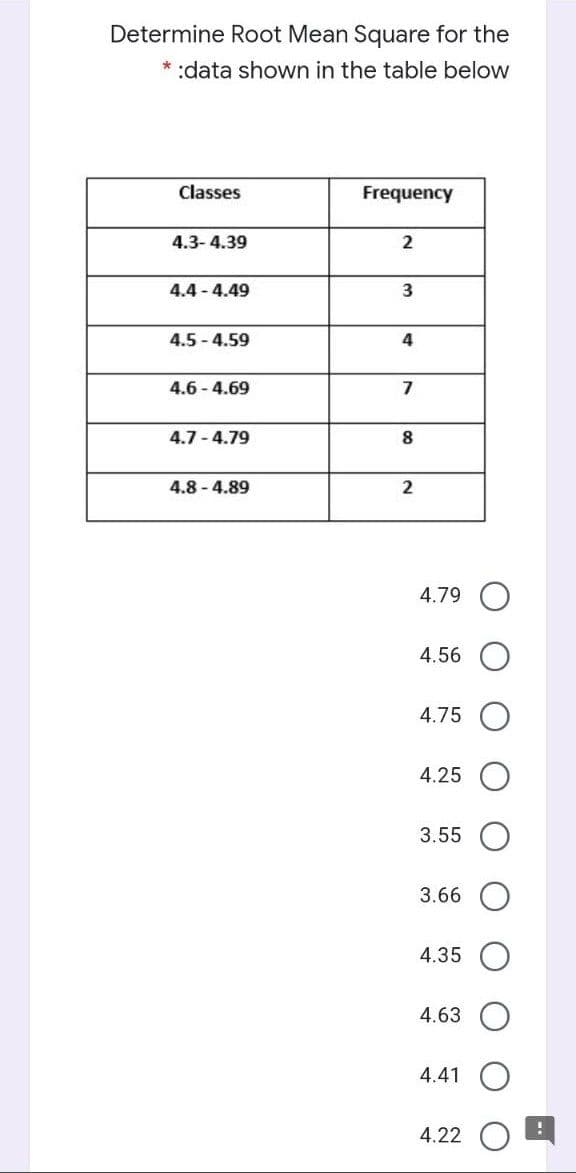
Q: Determine the Root Mean Square for the * :data in the table below Classes Frequency 4.3-4.39 2 4.4 -…
A: We want to tell you which one is the correct choice
Q: Use technology and the StudentSurvey dataset to test whether the data provide evidence that there is…
A:
Q: ccn and actMedia provided a television channel targeted to individuals waiting in supermarket…
A:
Q: mean, variance, and standard deviation of the number of people who pass the ation in a sample of 150…
A: 1. Let , X be the number of applicants are able to pass the computer literacy test. Here , X has…
Q: 0². Find expressions for the following in terms of the mean and variance:
A:
Q: Big Rock is listed on the local stock exchange and its stock has had mixed performance over the last…
A: The objective is to find arithmetic and geometric mean over the three-year period COMPANY initial…
Q: e) Estimate the following statistical measures 1. Mean2. Median 3. Mode
A: Given, the frequency table for daily sales 100 sale unit. 1). The mean of the following data is…
Q: Consider the output shown in Table 4.1. The Mean Square value is missing. What is ts actual value?…
A: SS for regression = 10561.07486 df for regression = 19-16 = 3
Q: Examples on how to compute for the range, variance, expected value, standard deviation and…
A: Consider the data 3, 5, 6, 8 and 9. The range is 6, which is obtained below:…
Q: The mean is: [ Select] The median is: [Select] The sample standard deviation is: (Select]
A: From the provided information, The table can be constructed as: Tickets (x) Frequency (f) fx…
Q: a. Determine the quartiles for the data. b. Obtain and interpret the interquartile range. c. Find…
A: Since you have posted a question with multiple sub-parts, we will solve first three sub-parts for…
Q: The sample mean is often used as an estimator of the population mean because of its desirable…
A: Unbiasedness : The mean of sampling distribution is equal to the variable as it is calculated to…
Q: In statistical analysis, there are a few key parameters. Describe the following a) Median b) Mean c)…
A: Solution
Q: Conduct a hypothesis test to determine if these data provide convincing evidence that the average…
A: The hypotheses for this test is, Null hypothesis: H0:μc=μh=μl=μm=μsoy=μsun Alternative hypothesis:…
Q: Find the variance.
A: Given is a sample of 40 data points as shown below:
Q: a. Identify the population under consideration. b. Identify the variable under consideration. c. Is…
A: The population is the universe of similar items or events which is of interest in study/experiment.…

Step by step
Solved in 2 steps with 1 images
